Figure 1.

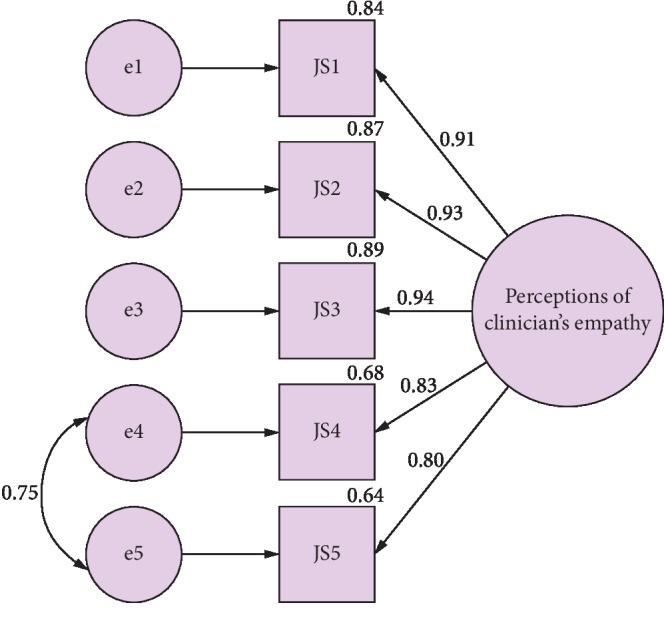
Path diagram for the confirmatory factor analysis with standardized regression estimates and squared multiple correlations.

Path diagram for the confirmatory factor analysis with standardized regression estimates and squared multiple correlations.