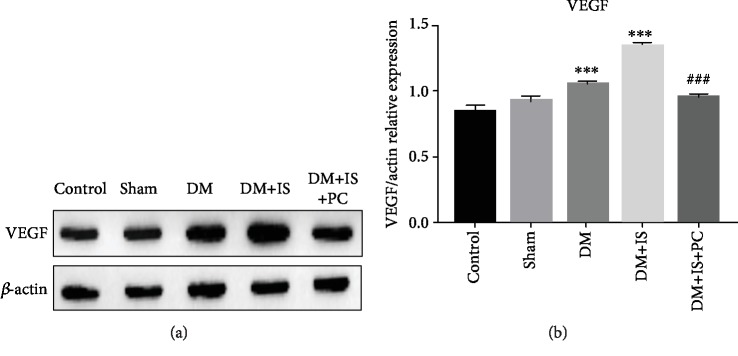
Figure 6.
The retinal expression of VEGF in all groups of tree shrews was quantitated by Western blot assay. (a) The experimental procedures were the same as stated in Figures 1 and 2. Representative images show the blots of VEGF and the loading control β-actin from retinal tissues in the indicated groups. (b) The relative expression level of retinal VEGF was quantitated through comparing the densitometry-based band intensity of VEGF to that of β-actin. Data were summarized from three independent experiments with similar results. ∗∗∗P < 0.001, compared with the control group; ###P < 0.001, compared with the DM+IS group.

