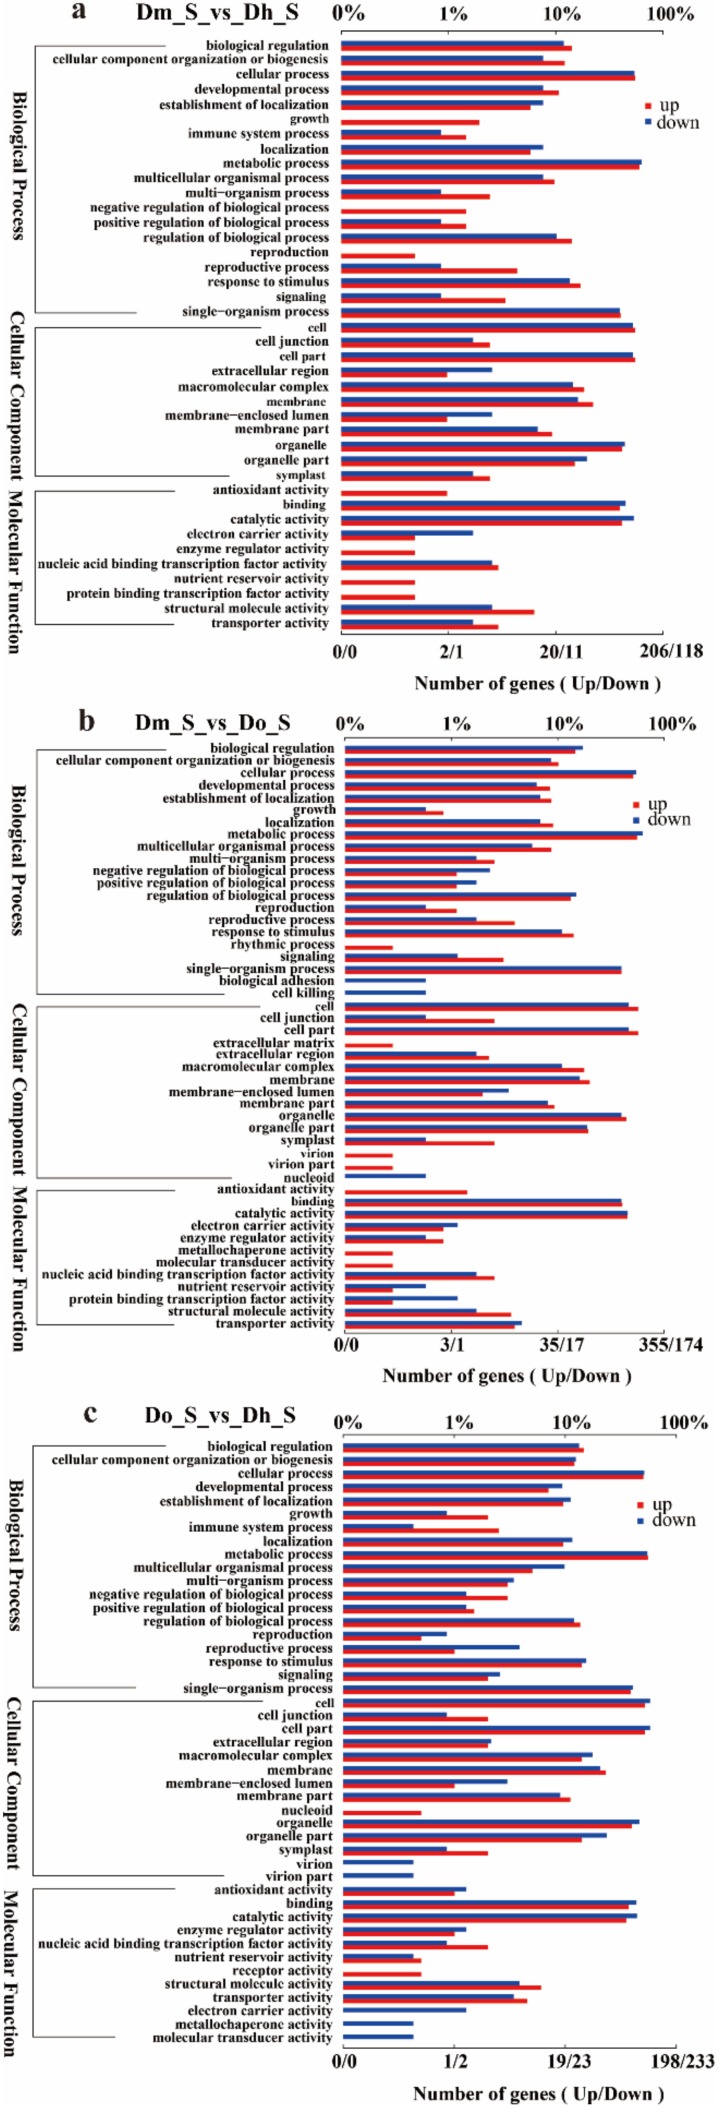
Figure 5.
Gene Ontology (GO) annotations of up and down regulated DEGs. The bottom x-axis indicates the number of DEGs annotated to a GO term, the upper x-axis indicates the proportion of DEGs annotated to a GO terms to the total number of all GO annotated DEGs; and the y-axis represents each detailed classification of GO. (a) Dm_S vs Dh_S GO annotation; (b) Dm_S vs. Do_S GO annotation; (c) Do_S vs. Dh_S GO annotation.

