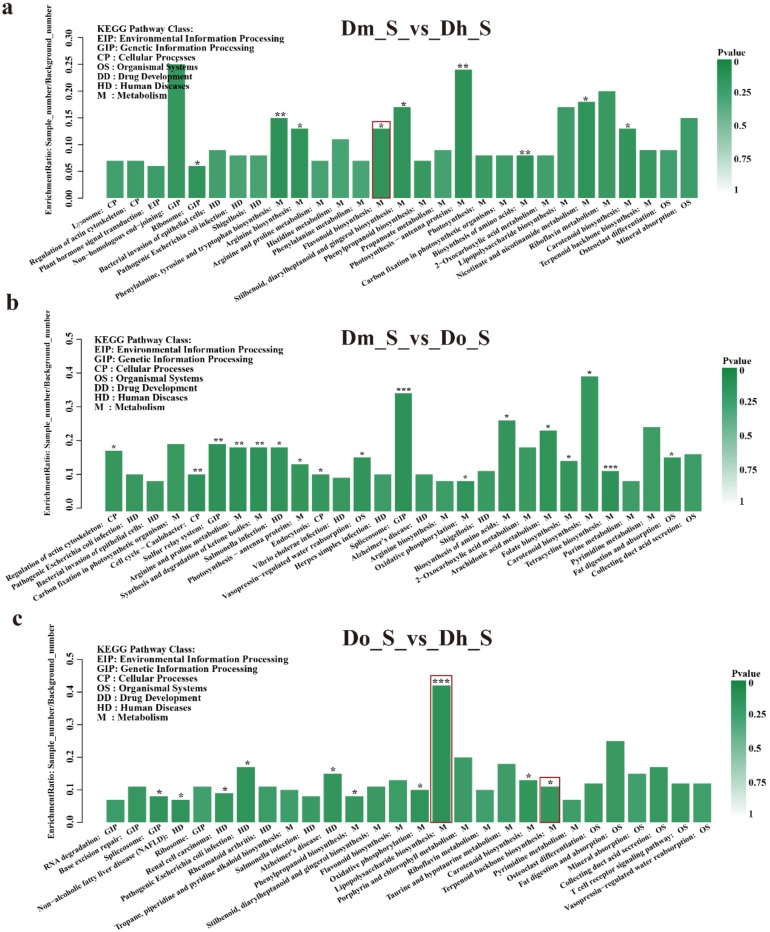
Figure 6.
Kyoto Encyclopedia of Genes and Genomes (KEGG) pathway enrichment of DEGs. The x-axis represents the pathway name, and the y-axis represents the enrichment ratio (sample number/background number). (a) Dm_S vs. Dh_S; (b) Dm_S vs. Do_S; (c) Do_S vs. Dh_S. All pathways in the figure with asterisks indicate significant KEGG enrichment, with three asterisks indicating p-value < 0.001, two asterisks indicating p-value < 0.01, one asterisks indicating p-value < 0.05.

