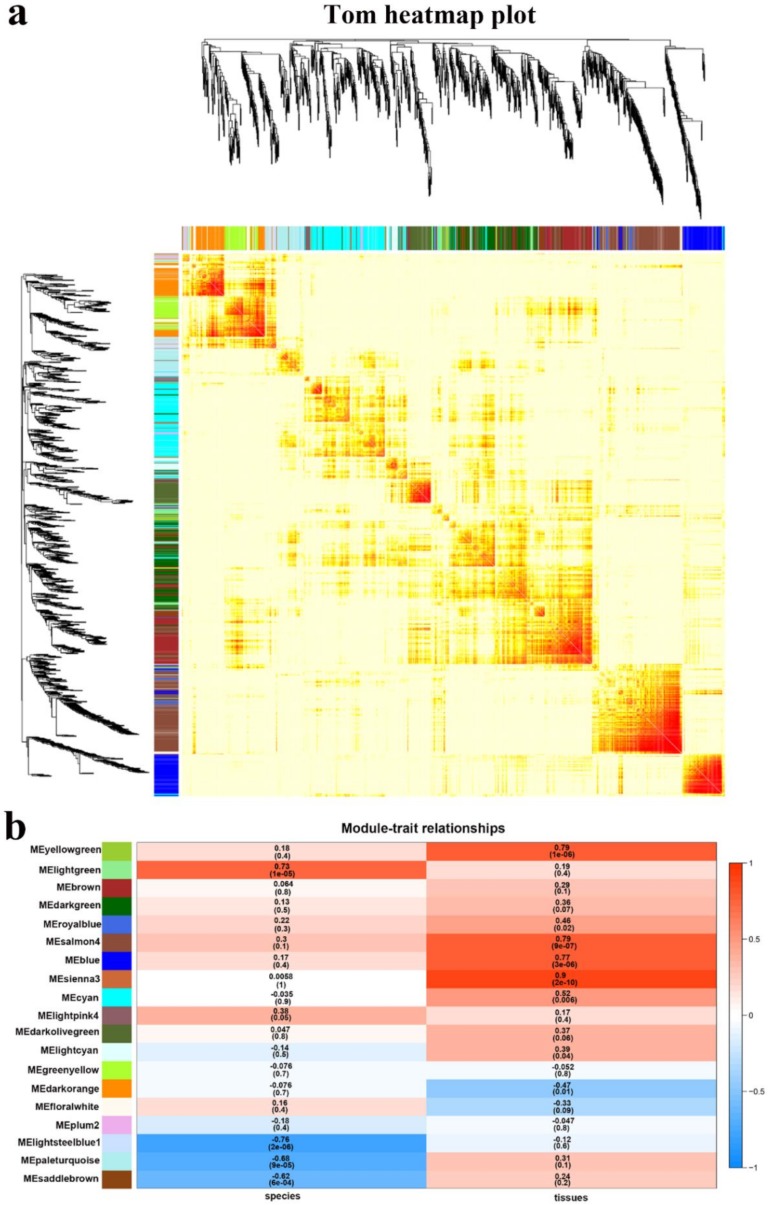
Figure 8.
Co-expression network analysis across different tissues and different species. (a) Visualizing the gene network using a heatmap plot. The heatmap depicts the topological overlap matrix (TOM) among all genes in the analysis. (b) Module-trait associations. Each row corresponds to a module characteristic gene (eigengene), and each column corresponds to a trait. Each cell contains a corresponding correlation and p-value. According to the color legend, the table is color-coded by correlation.

