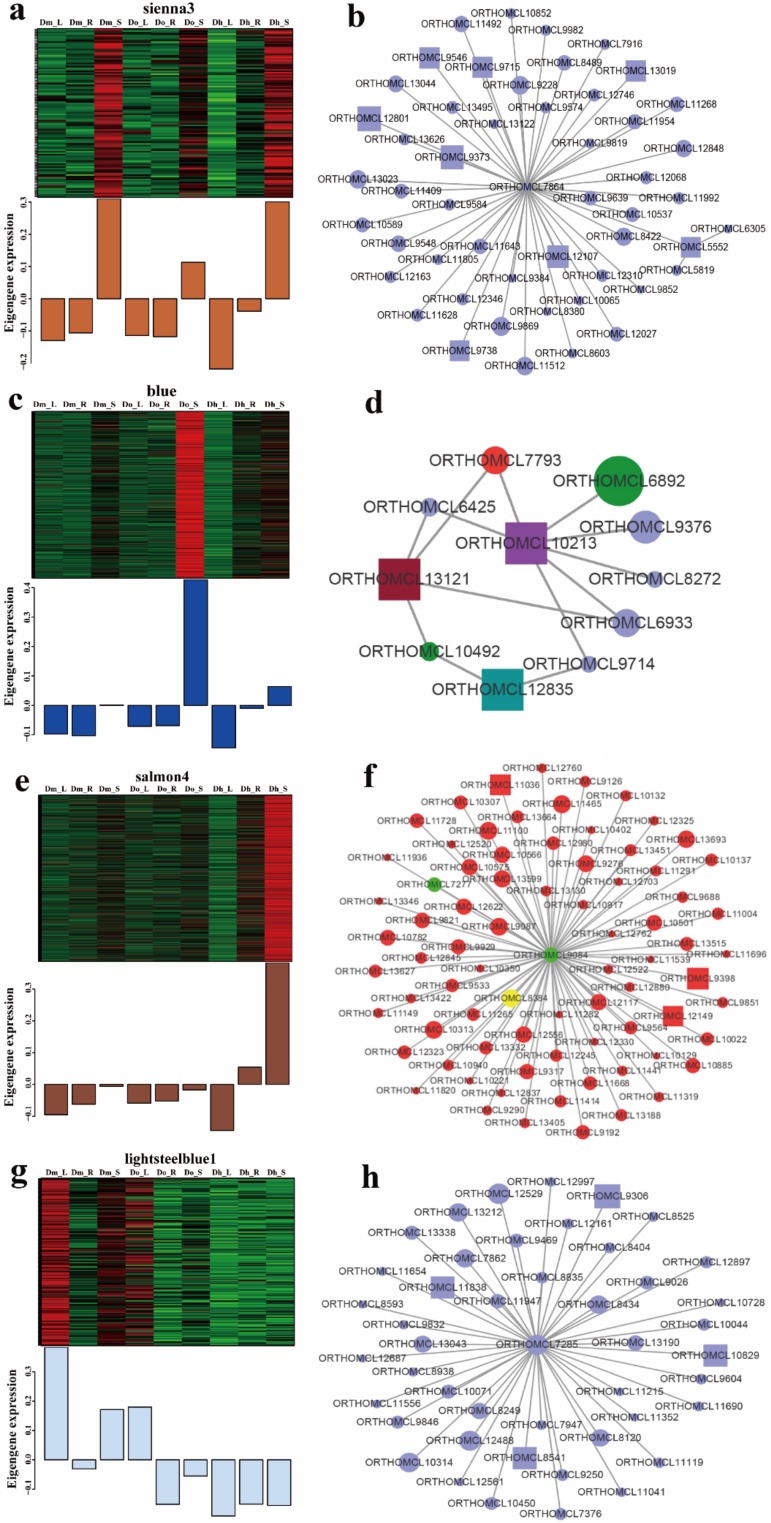
Figure 12.
Expression profile and transcriptional regulatory network associated with the tissue-specific modules. (a), (c), (e), and (g) heatmaps showing genes in module that were significantly over-represented in Dm_L, Dm_R, Dm_S, Do_L, Do_R, Do_S, Dh_L, Dh_R, Dh_S and predicted transcriptional regulatory network associated with the gene sets showing expression patterns at Dm_L, Dm_R, Dm_S, Do_L, Do_R, Do_S, Dh_L, Dh_R, and Dh_S. Heatmaps show the expression profile of all the co-expressed genes (number given on the top) in the modules (labelled on top). Candidate hub genes are shown in rectangular shapes. Purple in figure (b, d and h) represents genes related to polysaccharides. Red in figure (d and f) represents genes related to secondary metabolites. The shapes, from big to small, indicate the weights from big to small. Green in figure d represents bHLH transcription factors. Green in figure (f) represents bZIP transcription factors and yellow represents MYB transcription factors.

