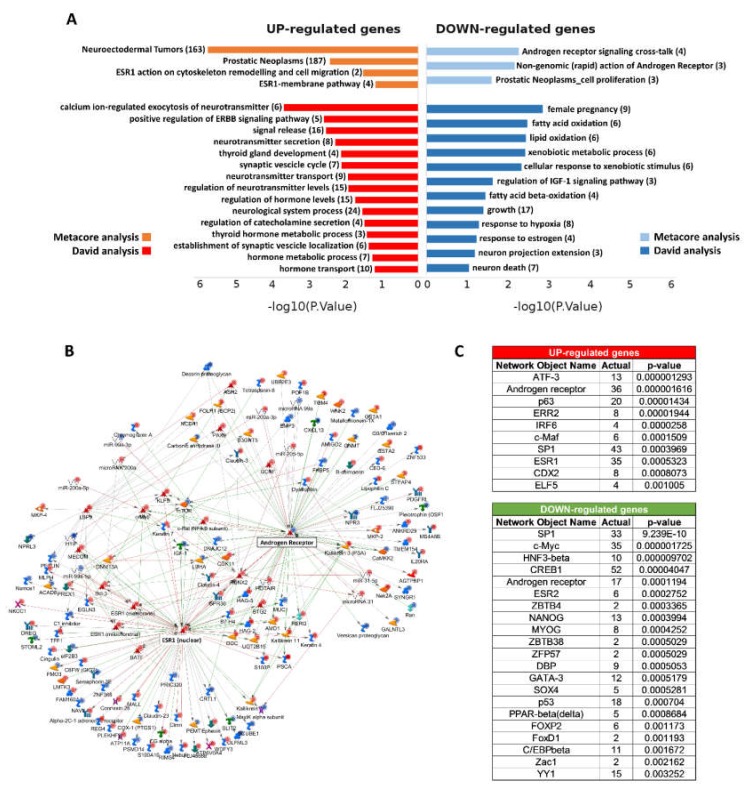
Figure 3.
(A) A selection of pathways derived from functional enrichment analysis of DEGs using Metacore (orange and light-blue bars) and David analyses (red and blue bars). The negative logarithm of the p-value (base 10) is reported on the X-axis. FDR p-values range from 3.31 × 10⁻⁵ to 0.9. The number of genes involved in each process is indicated in brackets. The complete list of pathways and processes is available in Supplementary Table S1. (B) The network of direct interactions starting from or pointing to AR and ESR1 proteins. More in detail, 70 connections started from AR, and 12 pointed to AR, while 75 links started from ESR1, and 26 pointed to ESR1. The objects that are over- or underexpressed in the data are marked with red/blue circles, respectively. Different edge colors were used to represent the activation (green), inhibition (red), and unspecified (grey) effects. (C) Transcription factor interactome analysis pointed out several enriched transcription factors that may putatively control a significant number of up- or down-regulated genes in the NE-live vs. AdenoPCa comparison.

