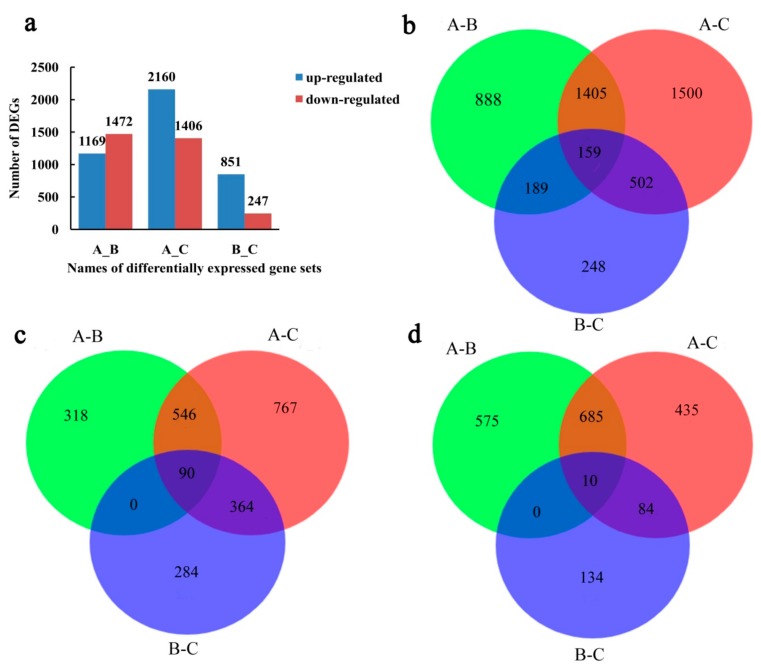
Figure 3.
The graphical representation of differentially expressed genes (DEGs) of Camellia oleifera ‘Huaxin’ in response to low-temperature stress. (a) Number of up/down-regulated DEGs in the A_B, A_C, and B_C differential expression gene sets; (b) Venn diagram showing all DEGs numbers among the three gene sets; (c) Venn diagram showing up-regulated genes DEGs numbers among the three gene sets; (d) Venn diagram showing down-regulated DEGs numbers among the three gene sets.

