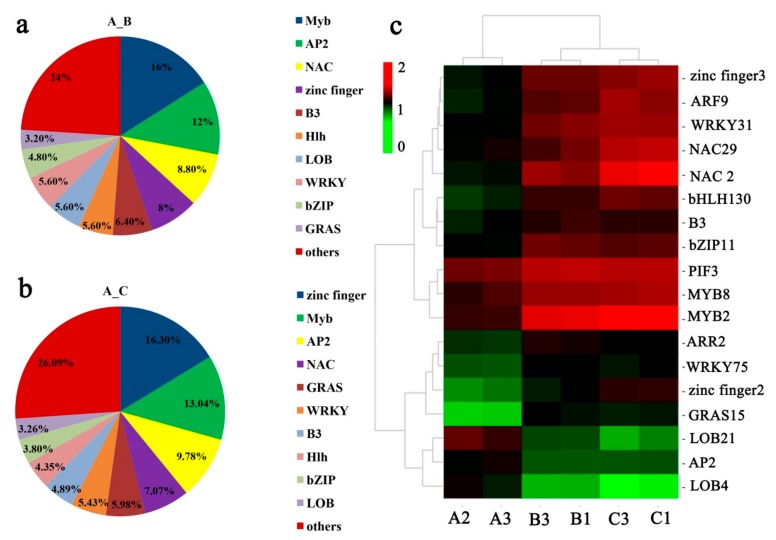
Figure 4.
Analyses of the transcription factors (TFs) involved in Camellia oleifera ‘Huaxin’ response to low-temperature stress. (a) Distribution of transcription factor families in the A_B gene set; (b) Distribution of transcription factor families in the A_C gene set; (c) Expression profiles of 18 differentially expressed TFs among different samples. The heat map was generated from the log10 (FPKM values). Changes in expression level are represented by a change in color; green indicates a lower expression level, whereas red indicates a higher expression level. FPKM: fragments per kilobase of transcript per million mapped reads

