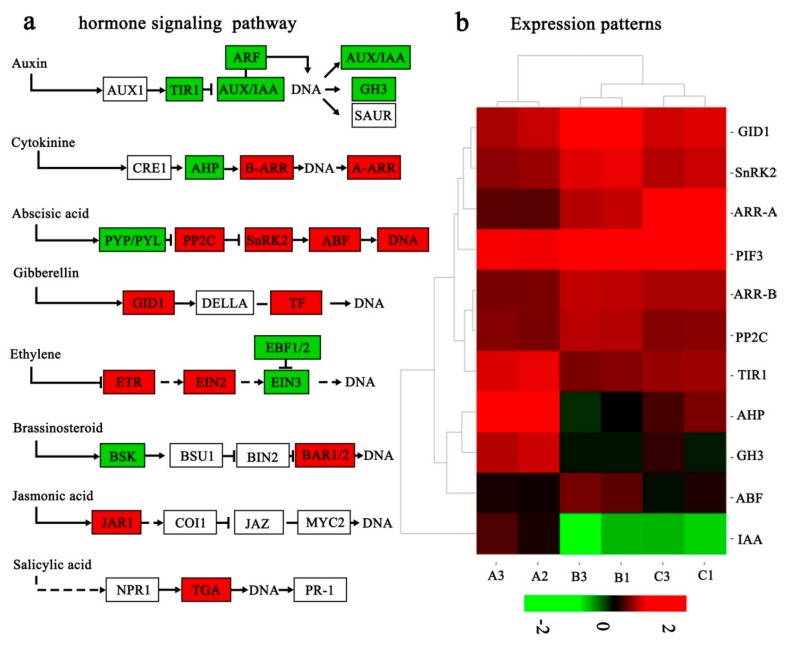
Figure 5.
The differentially expressed genes in the hormone signaling pathways in response to low temperature in Camellia oleifera ‘Huaxin’. (a) The green and red boxes show the mapped differentially expressed genes in the plant hormone signaling pathways, as modified from a Kyoto Encyclopedia of Genes and Genomes map (KO 04075), and the green boxes indicate down-regulated genes, whereas red boxes indicate up-regulated genes. (b) The expression patterns are shown as a heat map. Changes in expression level are indicated by a change in color, green indicates a lower expression level, whereas red indicates a higher expression level.

