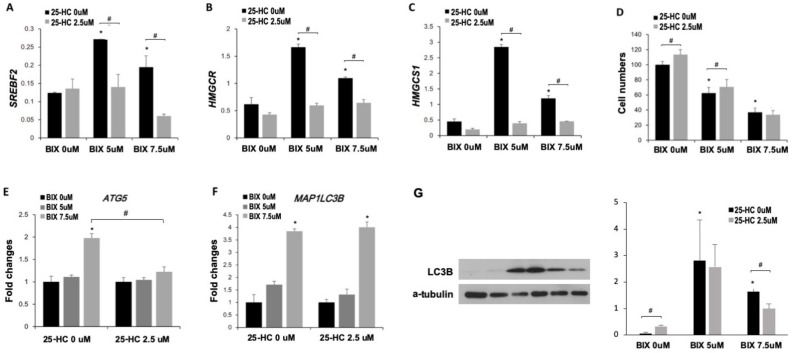
Figure 5.
Involvement of cholesterol biosynthesis pathway in BIX-induced cell death. (A–C) Expression of SREBF2 (A), HMGCR (B), and HMGCS1 (C) was analyzed in BIX- and 25-hydroxycholesterol (25-HC)-treated H1299 cells. (D) MTT assay was conducted in lysates of H1299 with BIX and 25-HC treatment, based on 0 μM of BIX and 25-HC as 100%. (E,F) Expression of the autophagy-related genes ATG5 (E) and MAP1LC3B (F) was analyzed in BIX- and 25-HC-treated H1299 cells. Data were normalized by the value of 0 μM BIX in each 25-HC treatment. (G) LC3B protein levels were analyzed by Western blotting after BIX and 25-HC treatment for 48 h in H1299 cells. α-Tubulin levels are shown as loading control. Relative intensities of LC3B-II bands against a-tublin were quantified and presented in the right panel. * p < 0.05 versus 0 μM BIX treatment. # p < 0.05 versus 2.5 μM 25-HC treatment.

