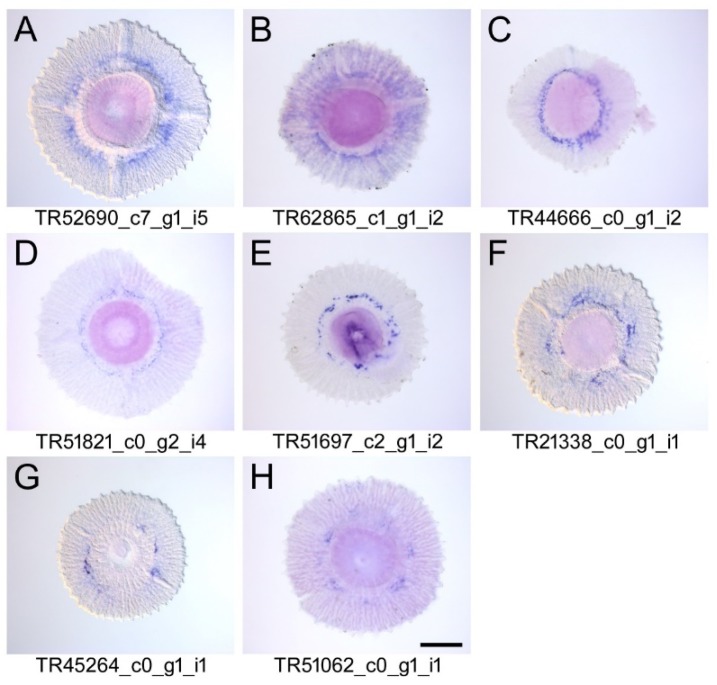
Figure A3.
In situ hybridization screen panel 3. (A–H) Ventral view onto the tube foot disc. The distribution of the in situ hybridization signal (blue) is weak, but shows distinct expression in a subset of disc cells. Therefore, these transcripts represent proteins of unknown function. Scale bar, 200 µm.

