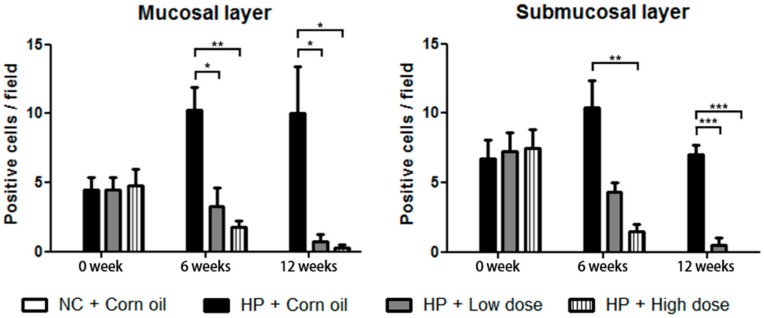
Figure 7.
Immunohistochemistry of gastric mucosal and submucosal layer in H. pylori-infected Mongolian gerbils. Statistical analysis of data obtained from photomicrograph images (Figures S3 and S4). H. pylori-positive cells were identified by counting the number of cells staining intensely in five fields from each sample and 2−3 gastric tissues were assessed for each group. Data in the bar graphs are presented as the mean ± SEM. Results were analyzed by Student’s t-test (** p < 0.01 and *** p < 0.001).

