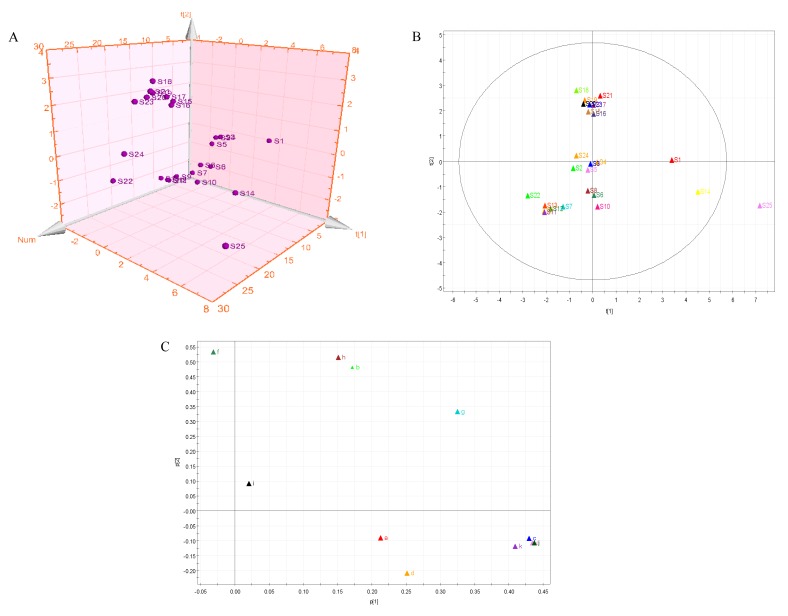
Figure 4.
(A) The 3D scatter plot of scores of samples from the principle component analysis (PCA) model. (B) PCA score plot of 25 Moringa oleifera samples. (C) The loading scatter plot of the PCA model (a: gallic acid; b: chlorogenic acid; c: vanillin; d: ferulic acid; e: gallogen; f: rutin; g: isoquercetin; h: quercitrin; i: baicalin; j: quercetin; and k: kaempferide).

