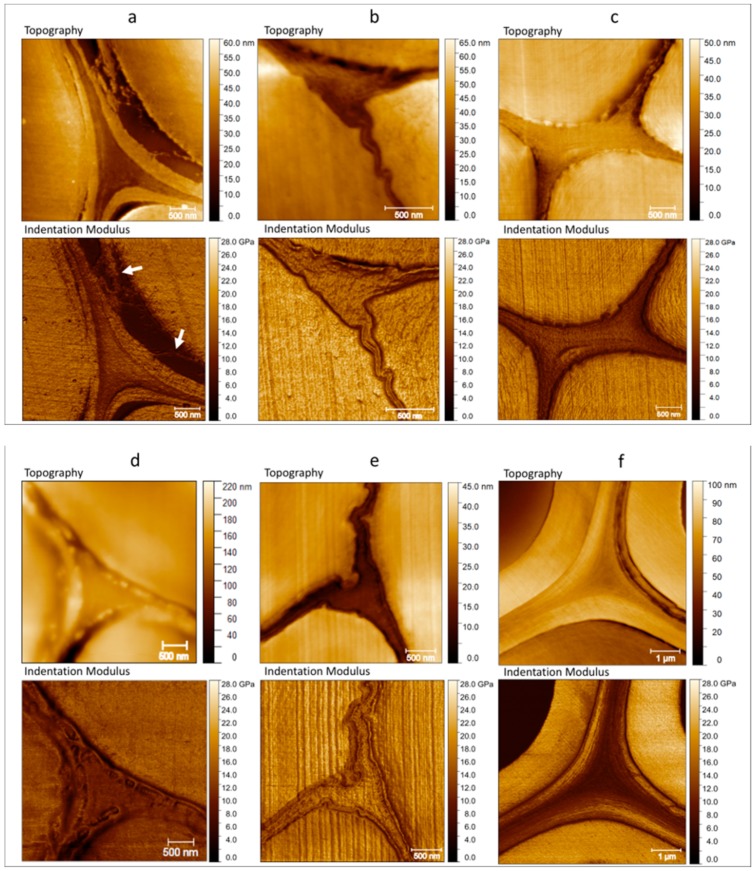
Figure 2.
Topography (top) and indentation modulus (bottom) of the cell corners of (a) flax with illustration of decohesion (highlighted with white arrows) between S1 and S2 layers, (b) nettle with values of indentation modulus close to those of the cell wall, (c) jute, (d) kenaf, (e) hemp with the highest indentation modulus, and (f) date palm tree with the lowest indentation modulus but with a homogeneous and thick area for the middle lamella.

