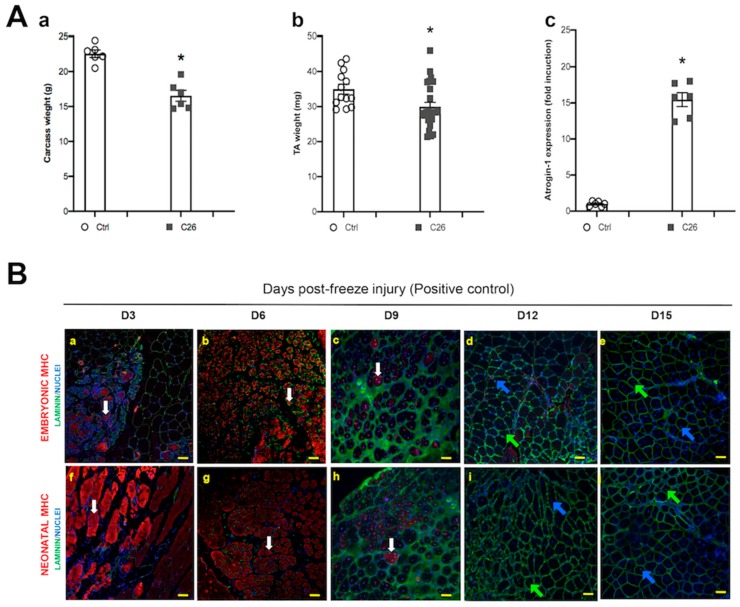
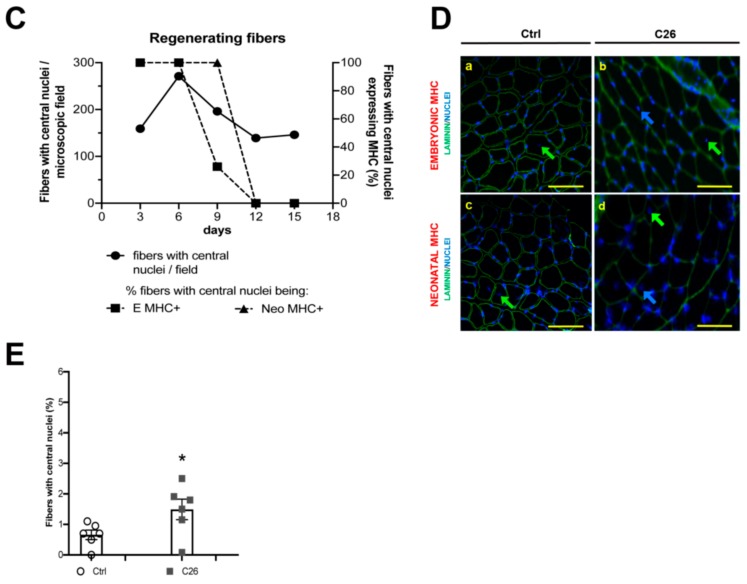
Figure 1.
Myofibers with central myonuclei do not express bona fide early regeneration markers in the tibialis of cachectic mice. (A) Carcass (i.e. net body weight, minus tutor weight) (a) and tibialis anterior (TA) muscle (b) weight in control (Ctrl) and in tumor-bearing (C26) mice, showing a significant decrease of body and muscle mass in cachexia. Muscle wasting is due to protein dismantling, as shown by the muscle-specific Ub-ligase Atrogin-1 upregulation in cachexia (c). For carcass weight (a) and Atrogin-1 (c) n = 6 for each group; for TA weight n = 12 and n = 25, for Ctrl and C26, respectively; * p < 0.05, by Student’s t test. (B) Photomicrographs of TA muscle at 3, 6, 9, 12 and 15 days (D3 to D15) following freeze injury, immunostained for embryonic (a–e) or neonatal (f–j) MHC (red); nuclei are counterstained by Hoechst (blue), while laminin immunostaining (green) highlights muscle fibers. Embryonic MHC+ and MHC- fibers with central myonuclei are indicated by white arrows (a,b,c,f,g,h) or blue and green arrows (d,e,i,j), respectively. (C) Quantification of muscle fibers showing central myonuclei and expressing embryonic MHC. These fibers stop expressing the regeneration markers at D9. (D) Photomicrographs of TA muscle immunostained for embryonic (a and b) or neonatal (c and d) MHC (red) and laminin (green), in control (a, c) and C26-tumor bearing (b, d) mice; nuclei are counterstained by Hoechst (blue). Fibers with central myonuclei, negative for either type of MHC, are indicated by blue or green arrows (in the first case the nucleus is just displaced from its subsarcolemmal position, while in the second case it is closer to the center of the fiber). Scale bar is 50 μm. (E) Quantification of the fibers with central myonuclei observed in D.


