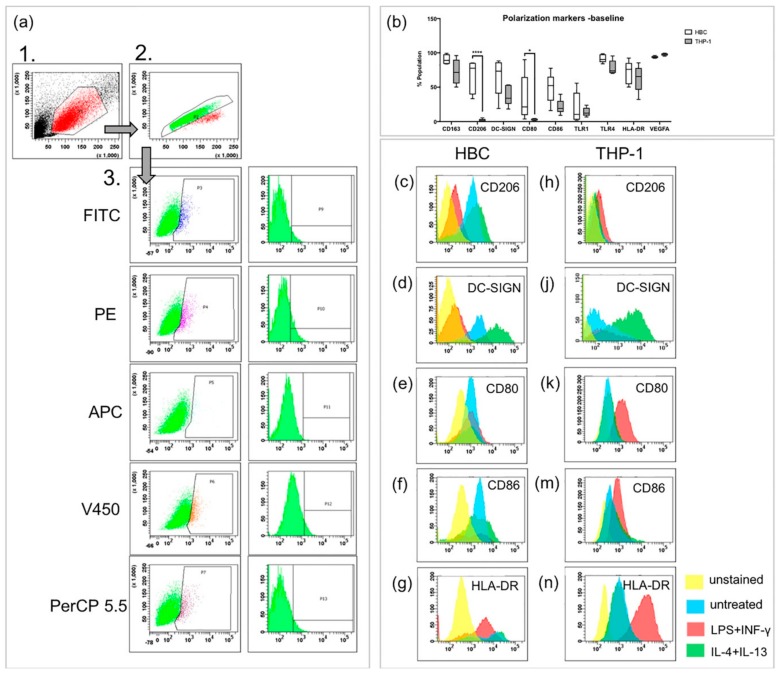
Figure 1.
FACS analysis of polarization markers on Hofbauer cells (HBCs) and THP-1 cells. (a) Gating strategy in three steps, as performed in an unstained sample of HBCs. The same gating strategy was employed for THP-1 cells, minimally adjusting the third gate for the slightly different auto-fluorescence of THP-1 cells. (b) Comparison of marker expression on HBCs and THP-1 macrophages at baseline without treatment; *** p<0.001, * p=0.03. Box and whiskers plot represents data from n = 5 individual experiments per cell type depicted from minimum to maximum, the line within the box represents the median. (c,d) CD206 staining on HBC and THP-1 macrophages, respectively. (e,f) DC-SIGN staining on HBC and THP-1 macrophages, respectively. (g,h) CD80 staining on HBC and THP-1 macrophages, respectively. (j,k) CD86 staining on HBC and THP-1 macrophages, respectively. (m,n) HLA-DR (MHC-II) staining on HBC and THP-1 macrophages, respectively. Yellow histogram peaks represent unstained samples, blue represents unstimulated cells, red represents cells stimulated by LPS + INF-γ and green represents cells stimulated by IL-4 and IL-13. Histograms of one representative experiment are shown and for each cell type five individual experiments were conducted (n = 5).

