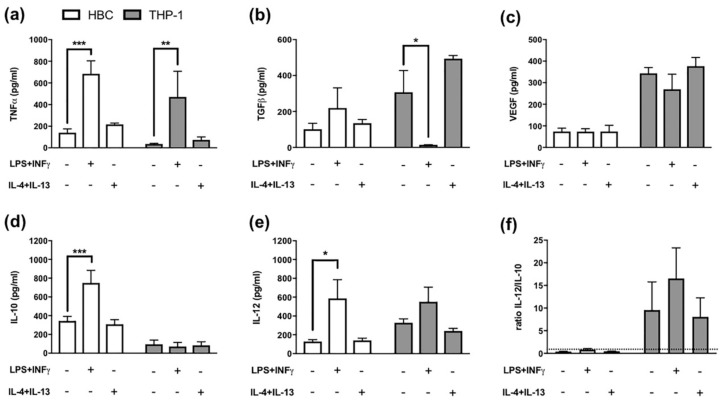
Figure 2.
Cytokine Release from Hofbauer cells and THP-1 macrophages. (a) ELISA against TNF-α, *** p = 0.0005; ** p = 0.0045 (b) ELISA against TGF-β, * p = 0.02 (c) ELISA against VEGF, (d) ELISA against IL-10, *** p = 0.0007 (e) ELISA against IL-12, * p = 0.02 and (f) Ratio representing the proportion of IL-12 to IL-10 levels. The dotted line represents a ratio of 1. White bars = HBCs, grey bars = THP-1 macrophages. All data mean ± SD from 5 individual experiments each. Matched two-way ANOVA with Dunnett’s post-hoc test was used for statistical analysis.

