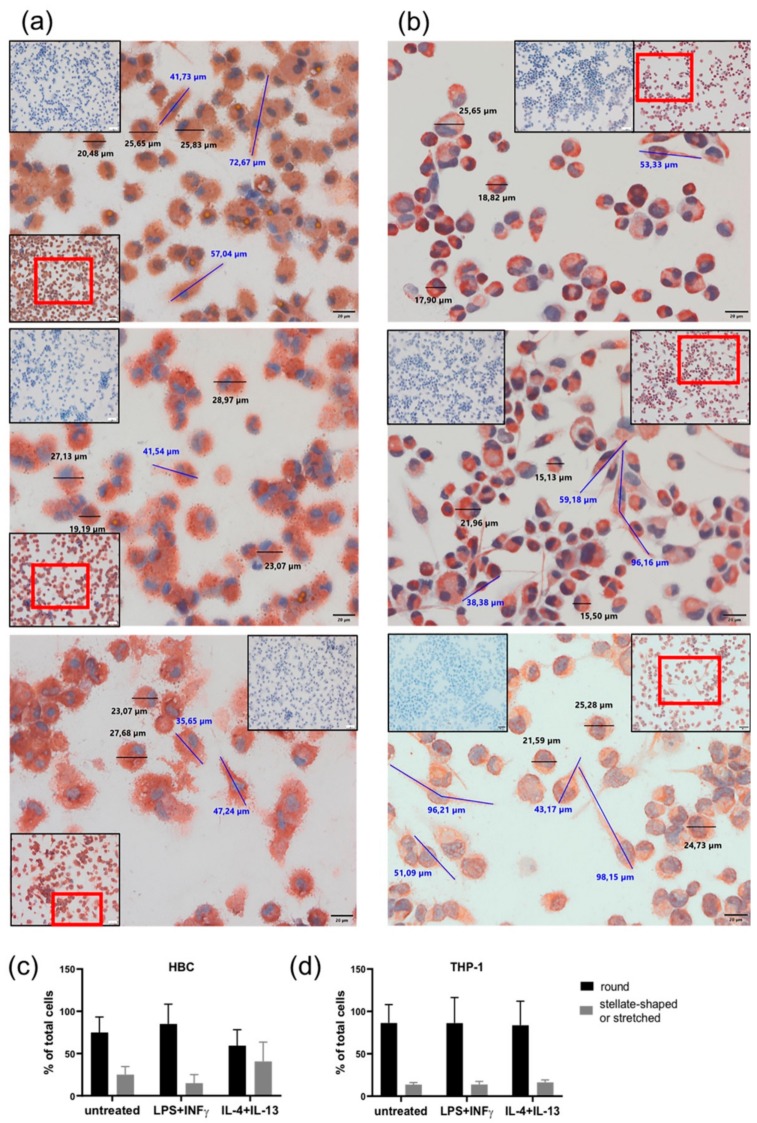
Figure 3.
Changes in cell morphology upon phenotypical stimulation of macrophages. (a) HBCs exposed to no stimulus (top panel), LPS + INF-γ (center panel), or IL-4 + IL-13 (bottom panel). (b) THP-1 exposed to no stimulus (top panel), LPS + INF-γ (center panel), or IL-4 + IL-13 (bottom panel). Representative images out of 5 individual stainings per cell type are shown. Main pictures were taken at 40× magnification (scale bar = 20µm). Inserts show negative control stainings (blue) as well as a 20× magnification picture to provide a bigger picture, with the section chosen for 40× magnification in a red frame. Cell size was measured using CellSens Standard measuring tool. Representative round cells are marked by black bars and their respective size is given, elongated cells are marked by blue bars and their size is given. (c) Quantification of round and elongated or strellate-shaped HBCs upon stimulation compared to untreated control. (d) Quantification of round and elongated or stellate-shaped THP-1 upon stimulation compared to untreated control. For quantification, five different positions on a CD68 stained slide (n = 3 individual experiments/cell type) were photographed and cells counted.

