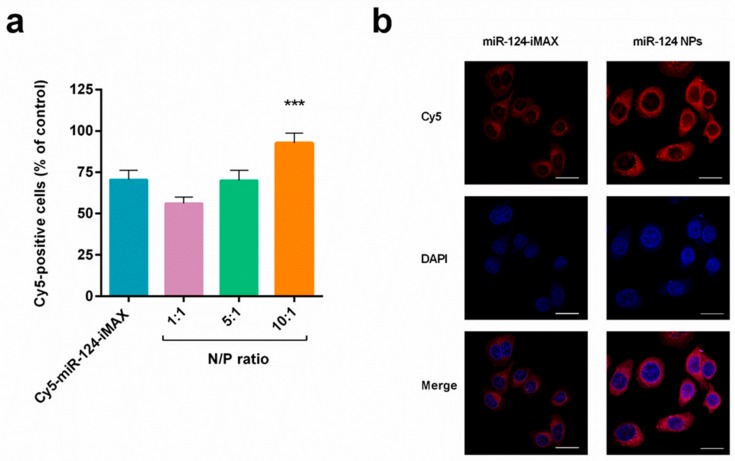
Figure 3.
Intracellular delivery efficiency of PHB-PEI NPs/miR-124 complexes. (a) PC3 uptake of miR-124 NPs analyzed by Fluorescent Activated Cell Sorting (FACS). To facilitate observations, miR-124 was labeled with the Cy5 fluorescent probe (red) to form Cy5-miR-124-NPs at different N/P ratios (1:1 to 10:1). Lipofectamine RNAiMAX (iMAX) was used as a control. Cells were incubated with fluorescent nanocomplexes for 4 h, washed with PBS, and incubated for another 20 h prior to analysis by flow cytometer (mean ± SD, n = 6). Statistically significant variations: *** p < 0.001 N/P 10:1 versus N/P 5:1, N/P 1:1, and iMAX. (b) Fluorescence images of PC3 cells incubated with Cy5-miR-124-NPs (N/P ratio 10:1) or Cy5-miR-124-iMAX for 4 h. Magnification 40×, scale bar is 50 μm.

