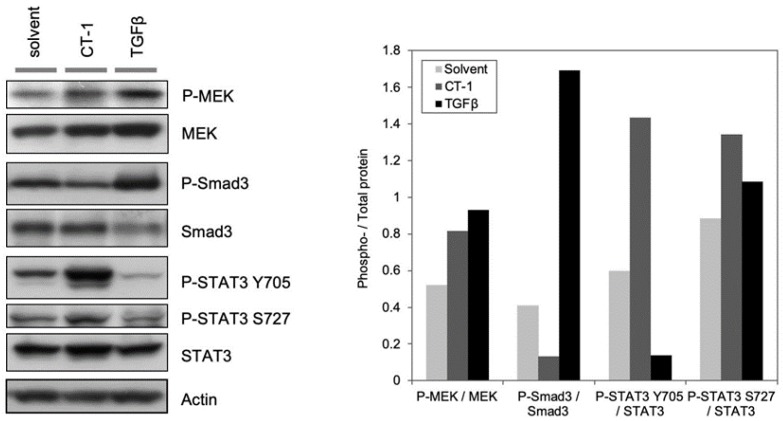
Figure 2.
TGFβ stimulates MEK phosphorylation. C2C12 cells were seeded onto cell culture plates at equal density and maintained in TGFβ (1ng/mL), CT-1 (10ng/mL), or solvent. Total protein samples were extracted from the cells and equal amounts of total protein (20 μg) were subjected to Western blotting analysis. The levels of indicated proteins were assessed by a standard immuno-blotting technique with a specific primary antibody. Actin indicates equal amounts of protein loading into each lane (left panel). The experiment was done three times. Quantification of band intensity of the phospho- and corresponding total protein in the left panel were measured using ImageJ, and the ratios of the band intensity of the phospho- to the corresponding total protein band were graphed in each condition (right panel).

