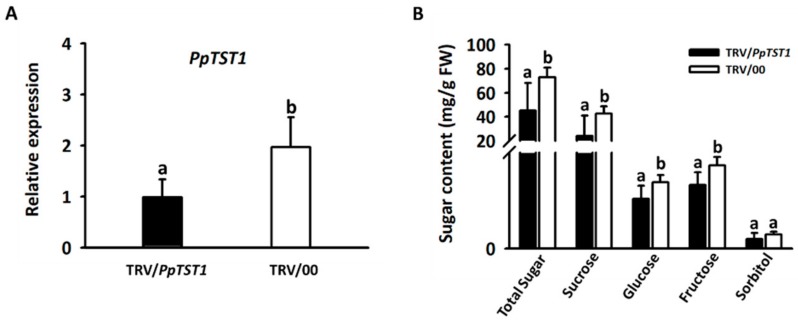
Figure 5.
Functional analysis of the PpTST1 gene using the virus-induced gene silencing (VIGS) system in peach fruits. (A) expression of PpTST1 in peach fruit injected with pTRV2-PpTST1/pTRV1 and pTRV2/pTRV1 (control), respectively. (B) sugar accumulation in peach fruit injected with pTRV2-PpTST1/pTRV1 and pTRV2/pTRV1, respectively. Different lowercase letters indicate significant differences between fruits injected with pTRV2-PpTST1/pTRV1 and pTRV2/pTRV1 (Student’s t test at p < 0.05). pTRV2-PpTST1/pTRV1 and pTRV2/pTRV1 are indicated with TRV/PpTST1 and TRV/00, respectively. Error bars represent standard error (SE) of three biological replicates.

