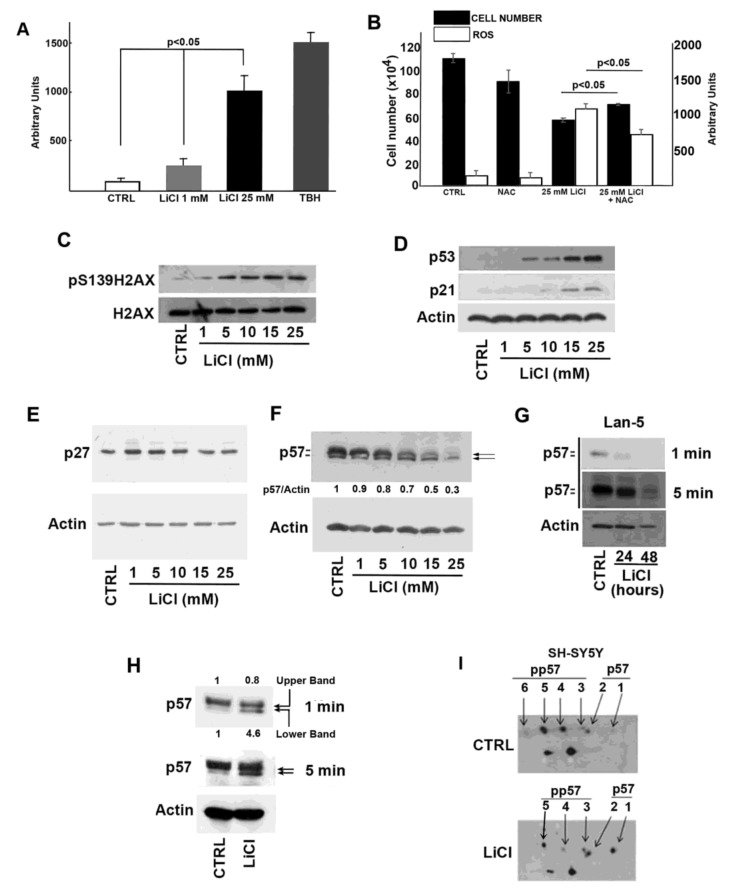
Figure 2.
Effect of lithium on ROS production, DNA damage, and p57 cellular content. (A) Effect of different amounts of LiCl on intracellular ROS level in SH-SY5Y cells. Treatment with 1 mM tert-butyl hydroperoxide (TBH) was used as the positive control. The data shown represent the mean of three independent experiments, and the standard deviation (T bar) is reported. A p-value < 0.05 denotes significant difference. (B) SH-SY5Y cells were treated with 25 mM LiCl in the presence or absence of N-acetylcysteine (NAC). CTRL refers to cells incubated with 25 mM NaCl; NAC represents cells exposed to 25 mM NaCl plus 150 µM NAC. The growth rate was evaluated by direct cell counting after 24 h incubation. The plot also shows the intracellular ROS levels determined as in (A). Data are the mean of three independent experiments, and the standard deviation (T bar) is reported. A p-value <0.05 denotes a significant difference. (C) Western blotting analysis of the variation of the amount of γH2AX (pS139H2AX) and H2AX in response to the treatment of SH-SY5Y cells with different amounts of LiCl for 24 h. CTRL is represented by cells incubated with 25 mM NaCl for 24 hours. (D) As in panel (C), except that p21Cip1 (p21) and p53 were analyzed in the cell extracts. Equal loading of proteins was verified by determining actin content. (E) As in panel (C), except that p27Kip1 was analyzed. Actin content was determined to verify equal loading of proteins. (F) As in panel (C), except that p57 levels were analyzed. The ratio between p57 and actin signal intensities is reported. (G) Lan-5 cells were treated with 25 mM NaCl (CTRL) or with 25 mM Li for 24 and 48 h, and cell extracts were analyzed for p57 content by immunoblotting. Equal loading of proteins was verified by determining actin content. Films at two different exposure times are shown. (H) SH-SY5Y cells were transfected for 8 h with 1 µg p57-pcDNA3.1 expression vector. Then, 25 mM NaCl (CTRL) or 25 mM LiCl were added to the cell media for additional 24 h. Thus, equal amounts of proteins were analyzed for p57 content by immunoblotting. The arrows represent the upper and lower p57 signals. The p57-specific signals were quantified as the ratio of the upper and lower signal over actin signal, respectively. Films at two different exposure times (1 and 5 min) are shown. (I) SH-SY5Y cells were treated with 25 mM NaCl (CTRL) or 25 mM LiCl for 24 h. After the treatment, cell extracts were analyzed for p57 by bidimensional immunoblotting using anti-p57 mouse monoclonal Ab. The isoforms at the upper level correspond to phosphoforms with an increasing number of phosphate moieties (isoforms from 3 to 6). The lower level includes the unmodified form (signal 1) and the phosphoform with one phosphorylated residue (signal 2). Additional details are described in Materials and Methods, Section 5.

