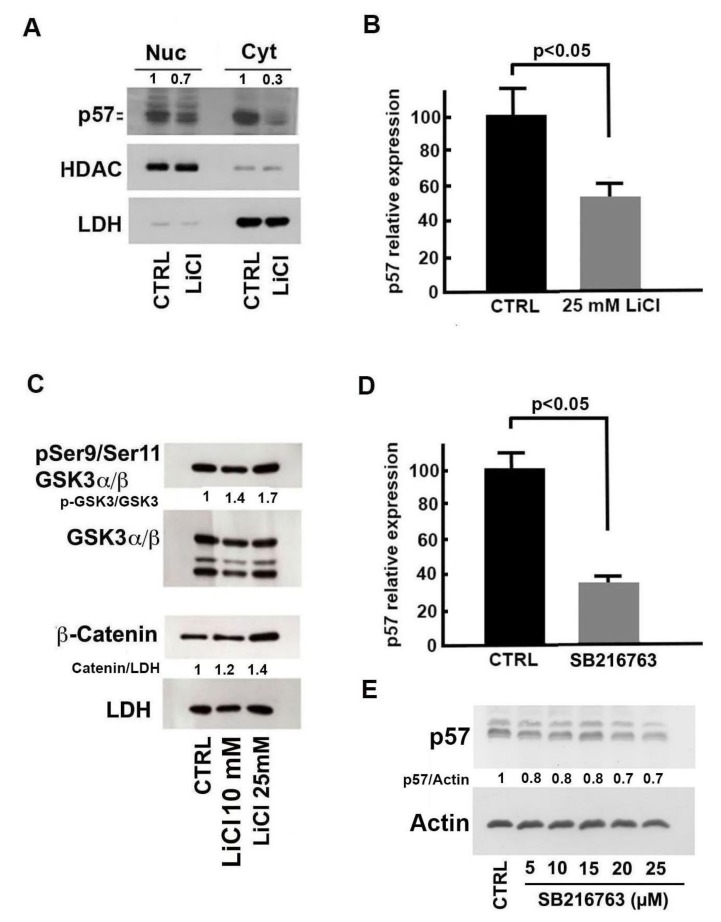
Figure 3.
Molecular mechanisms of lithium’s effect on p57 content. (A) Immunoblotting analysis of nuclear and cytosolic fractions of SH-SY5Y cells treated with 25 mM NaCl (CTRL) or LiCl for 24 h. HDAC1 and LDH were analyzed to confirm the efficiency of cell compartment fractionation and equal protein loading. The ratio between p57 and the loading control signal is also reported. (B) SH-SY5Y cells were treated with 25 mM NaCl (CTRL) or 25 mM LiCl for 24 h, and the CDKN1C transcript was evaluated by quantitative RT-PCR. The data shown are the mean of three independent experiments, and the standard deviation is reported. A p-value < 0.05 denotes significant difference. (C) SH-SY5Y cells were treated with 25 mM NaCl (CTRL) and with 10 and 25 mM LiCl for 24 h. Cell extracts were analyzed for phosphoserine21-phosphoserine9/GSK3α/β (pSer21/pSer9-GSK3α/β) and β-catenin content by immunoblotting. Equal loading of proteins was verified by determining the LDH content. The ratios between pSer21/pSer9-GSK3α/β and GSK3 α/β and β-catenin and LDH band intensities are also shown. (D) Effect of SB216763 treatment on CDKN1C expression. SH-SY5Y cells were treated with 25 µM SB216763 or with the vehicle DMSO (CTRL) for 24 h. CDKN1C expression was evaluated by quantitative RT-PCR. The data shown are the mean of three experiments, and the standard deviation is reported. A p-value < 0.05 denotes a significant difference. (E) SH-SY5Y cells were treated with different amounts of SB216763 for 24 h. Cell extracts were analyzed for p57 content by immunoblotting. The ratio between p57 and actin signal intensities is also shown. Further details for the densitometric analysis reported in panels (C) and (E) are described in Materials and Methods, Section 5.

