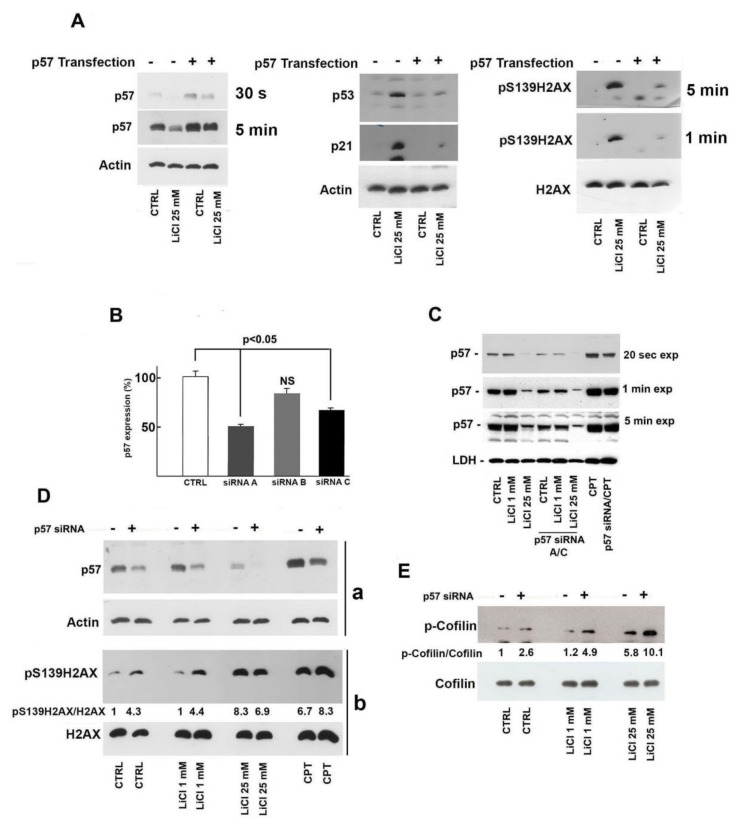
Figure 4.
Importance of the decrease of p57 in lithium-dependent DNA damage. (A) SH-SY5Y cells were plated in multiple wells at equal density (50–60% of confluency). After 24 h, an equal number of cells were transfected with 300 ng of a p57-encoding pcDNA3.1 plasmid or with a pcDNA3.1 empty vector; then, 8 h after transfection, each cell population was exposed to 25 mM LiCl or to 25 mM NaCl (CTRL) for 24 h. Cells extracts were analyzed by immunoblotting for specific proteins, as reported (p57 on the left, p53 and p21 in the middle, pSer139/H2AX and total H2AX on the right). Two films at different exposure times (30 s and 5 min) for p57 and for pSer139/H2AX (1 and 5 min) are shown. (B) Three different siRNAs directed against CDKN1C (named siRNA A, B, and C) were transfected (at 100 nM concentration) in SH-SY5Y cells (see Materials and Methods, Section 5). Forty-eight hours after transfection, cells were harvested, and total RNA was prepared. CDKN1C expression was evaluated by quantitative RT-PCR. The data shown are the mean of three experiments, and the standard deviation (T bar) is reported. (C) SH-SY5Y cells were first transfected with a mixture of anti-p57 siRNA A and siRNA C (siRNA A/C) for 48 h and thereafter exposed to 1 mM and 25 mM LiCl for 24 h; a specific control included cells incubated for 24 h with 25 mM NaCl after 48 h of transfection with a scramble siRNA. The transfected cells were also compared to SH-SY5Y cells treated with the two different Li concentrations (1 mM and 25 mM) for 24 h. In addition, SH-SY5Y cells were treated with 2 µM CPT (camptothecin) for 5 h after transfection (or not) with siRNAs. Then, equal amounts of proteins were analyzed for p57 content by immunoblotting. LDH was used as equal loading control. Three different exposure times are shown to highlight signal differences. (D) SH-SY5Y cells were treated with NaCl (CTRL) or with LiCl at two different concentrations in the presence or absence of the siRNA mixture. Moreover, cells were treated with 2 µM CPT. After 24 h, cell extracts were prepared and analyzed. In (a), p57 and actin levels were investigated while, in (b), γH2AX (pS139H2AX) and H2AX were studied. The ratios between p57/actin and γH2AX/H2AX were also reported. (E) The samples in (D) were analyzed for phosphoserine3-cofilin and cofilin content. The ratio between phosphocofilin and cofilin signal intensities is also shown. Details of the densitometry analysis are in Materials and Methods, Section 5.

