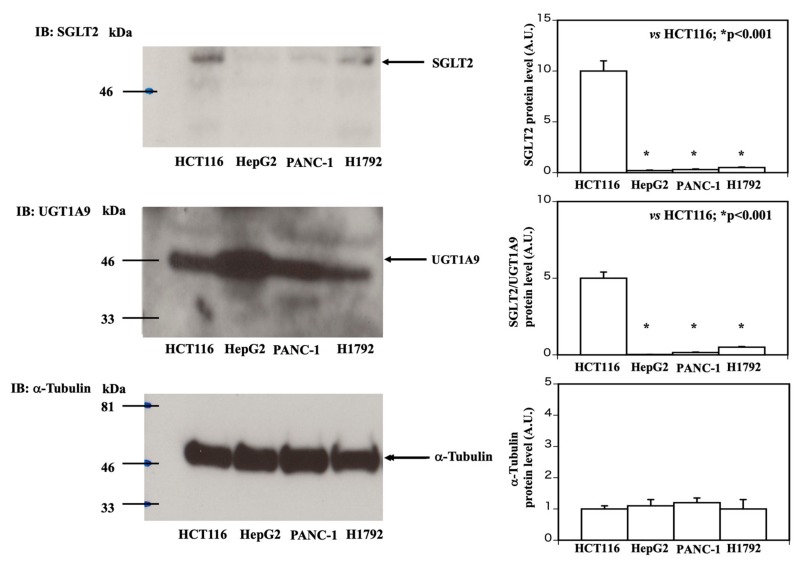
Figure 2.
Comparison of SGLT2 and UGT1A9 protein levels in HCT116, HepG2, PANC-1, and H1792 cells. HCT116, HepG2, PANC-1, and H1792 cell extracts were prepared and immunoblotted for SGLT2 (upper panel on left side), UGT1A9 (middle panel on left side), and alpha-tubulin (as loading control; lower panel on left side). The quantification of the SGLT2 protein levels (upper panel on the right side, n = 3, HCT116 vs. HepG2 or PANC-1 or H1792, * p < 0.001), SGLT2 protein levels against UGT1A9 protein levels (middle panel on the right side, n = 3, HCT116 vs. HepG2 or PANC-1 or H1792, * p < 0.001), and alpha-tubulin protein levels (lower panel on the right side, not significant among four cells) is shown as a bar graph.

