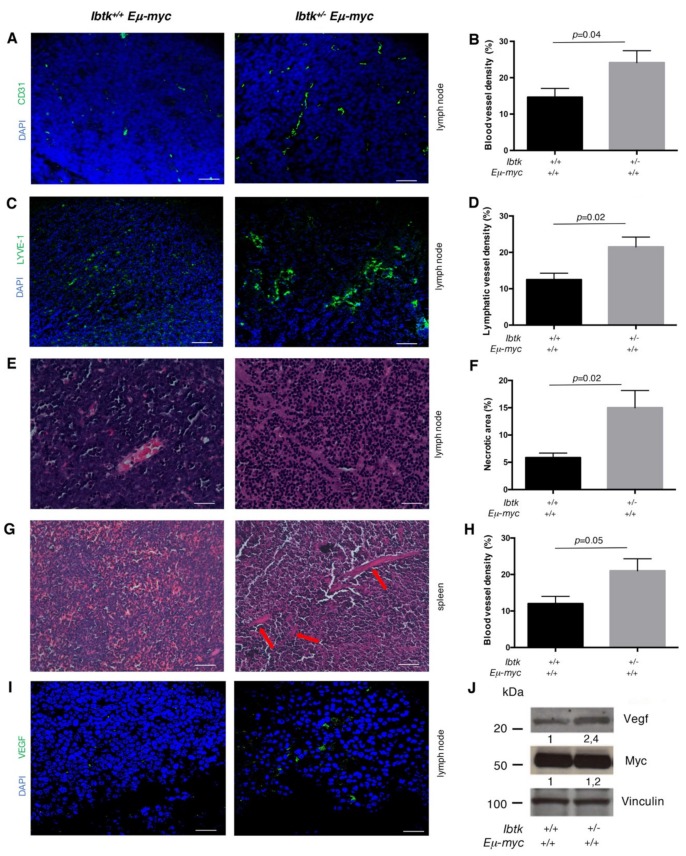
Figure 2.
IBTK haploinsufficiency results in increased tumor vascularization and tissue necrosis. A. Sections of tumor lymph nodes of Ibtk+/+Eμ-myc and Ibtk+/- Eμ-myc mice stained for CD31 (green) to visualize blood vessels, and analyzed by confocal microscopy. A representative image is shown. Scale bars: 150 µm. Magnification 200×. B. Quantitation of blood vessel density in cancerous lymph nodes of Ibtk+/+ Eμ-myc (n = 6) and Ibtk+/- Eμ-myc (n = 6) mice. Values are the mean ± SEM. C. Sections of tumor lymph nodes of Ibtk+/+ Eμ-myc and Ibtk+/- Eμ-myc mice stained for LYVE-1 (green) to visualize lymphatic vessels, and analyzed by confocal microscopy. A representative image is shown. Scale bars: 150 µm. Magnification 200×. D. Quantitation of the lymphatic vessel density in the tumor lymph nodes of Ibtk+/+ Eμ-myc (n = 6) and Ibtk+/- Eμ-myc (n = 6) mice. Values are the mean ± SEM. E. Sections of tumor lymph nodes stained by hematoxylin/eosin. Representative images of tumor tissues are shown. Scale Bars: 75 µm. Magnification 400×. F. Quantitation of necrosis levels was estimated as a percentage of the total area of tumor lymph nodes of Ibtk+/+ Eμ-myc (n = 6) and Ibtk+/- Eμ-myc (n = 6) mice. Values are the mean ± SEM. G. Spleen sections of sick Ibtk+/+ Eμ-myc and Ibtk+/- Eμ-myc mice stained by hematoxylin/eosin. Red arrows indicate marked vascularization in Ibtk+/- Eμ-myc mice. Scale bars: 150 µm. Magnification 200×. H. Quantitation of the vessel density in the spleen of Ibtk+/+ Eμ-myc (n = 6) and Ibtk+/- Eμ-myc (n = 6) sick mice. Values are the mean ± SEM. I. Sections of tumor lymph nodes of Ibtk+/+ Eμ-myc and Ibtk+/- Eμ-myc mice stained for VEGF (green) and analyzed by confocal microscopy. A representative image is shown. Scale Bars: 50 µm. Magnification 630 ×. J. Immunoblot analysis of VEGF, Myc, and vinculin expression in the protein extracts of B cells isolated from the tumor lymph nodes of Ibtk+/+ Eμ-myc and Ibtk+/- Eμ-myc mice. Protein bands were normalized to the corresponding vinculin intensity.

