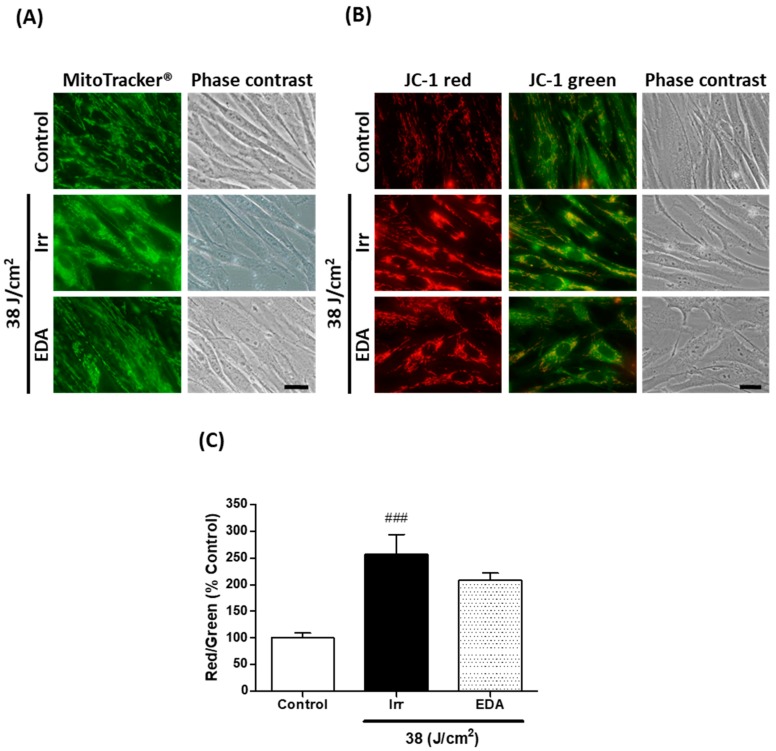
Figure 3.
Mitochondrial morphology and membrane potential in human fibroblasts exposed to artificial blue light and EDA pre-treatment. Cells were incubated with EDA 0.1 mg/mL for 24 h, irradiated at 38 J/cm2 and incubated with MitoTracker® or loaded with JC-1 to be observed under the microscope 24 h after irradiation. Mitochondrial morphology was documented using the fluorescent probe MitoTracker® (A). Mitochondrial membrane potential was evaluated with the dye JC-1 (B). Quantification of JC-1 red/green fluorescence ratio (n ≥ 5) (C). Data are shown as mean ±SEM. ### p < 0.001 vs control. Scale bar: 20 µm.

