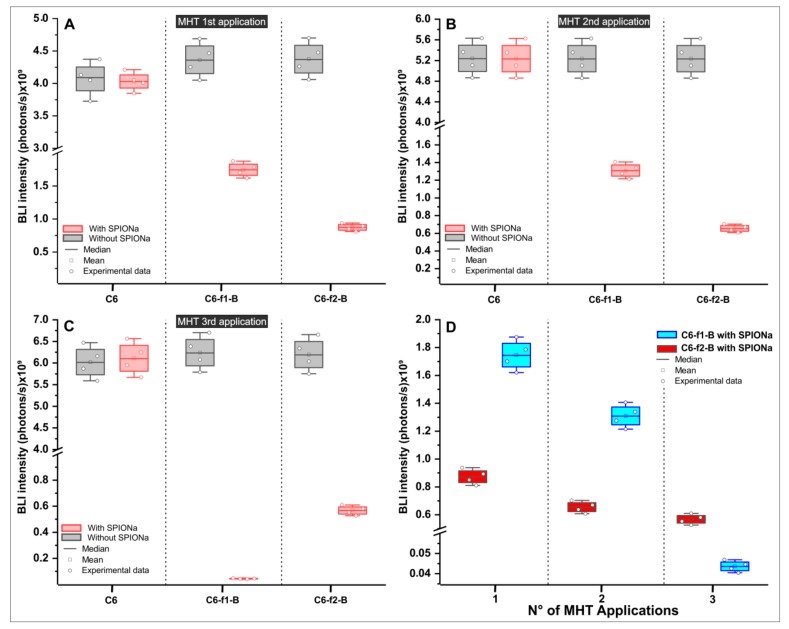
Figure 5.
Comparison of BLI signal intensity between groups with and without SPIONa in the MHT multiple applications. The box plot shows the BLI intensity in the experimental groups (A) after one MHT application, (B) after two MHT applications, (C) after three MHT applications, and (D) the comparison of BLI intensities between the therapeutic groups, analyzing the two sets of AMF configuration: (f1-B e f2-B f1 = 309 kHZ; f2 = 557 kHz e B = 300 Gauss).

