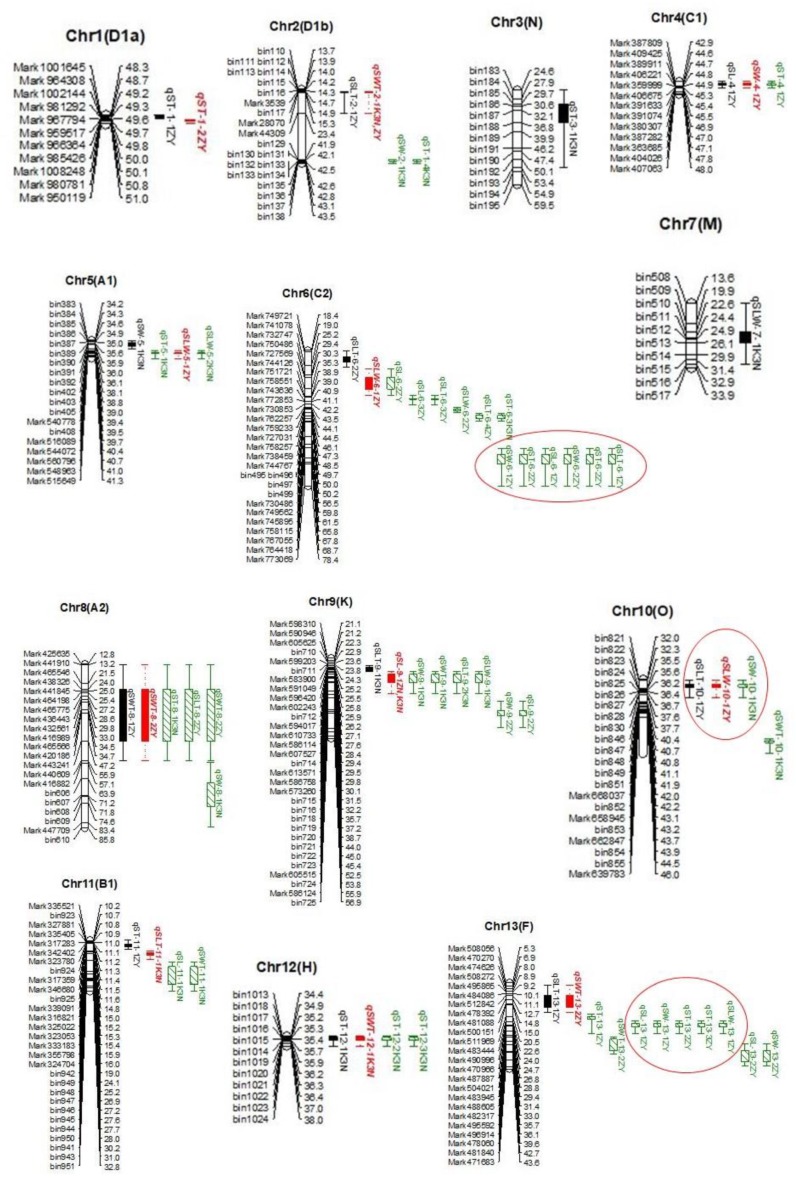
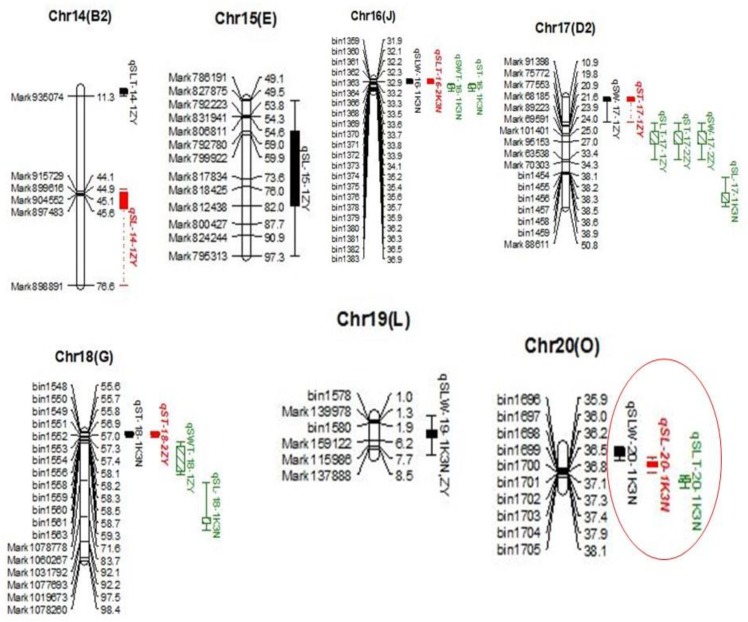
Figure 2.
Location of quantitative trait loci (QTLs) on the genetic linkage map of the ZY and K3N RIL populations. Distances among markers are indicated using the physical location to the right of the linkage groups; names of markers are shown on the left. Only those SNP/SLAF markers are shown that were in and around the QTL regions. The red circles indicate the four QTL hotspots/clusters. Colored bars represent different QTLs.


