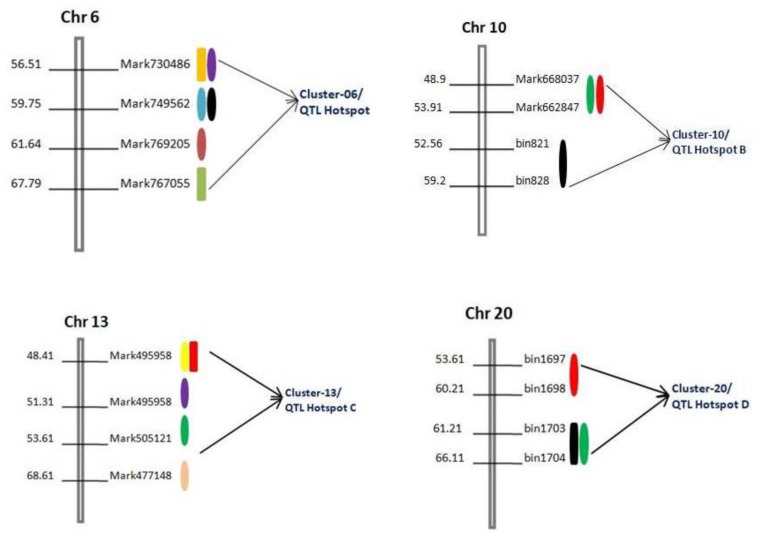
Figure 3.
Diagram showing the physical location of four QTL clusters/hotspot regions (cluster-06, cluster-10, cluster-13, and cluster-20) on four different chromosomes viz., Chr6, Chr10, Chr13, and Chr20 identified in two RIL populations across multiple environments Different colors indicate different QTLs within same region.

