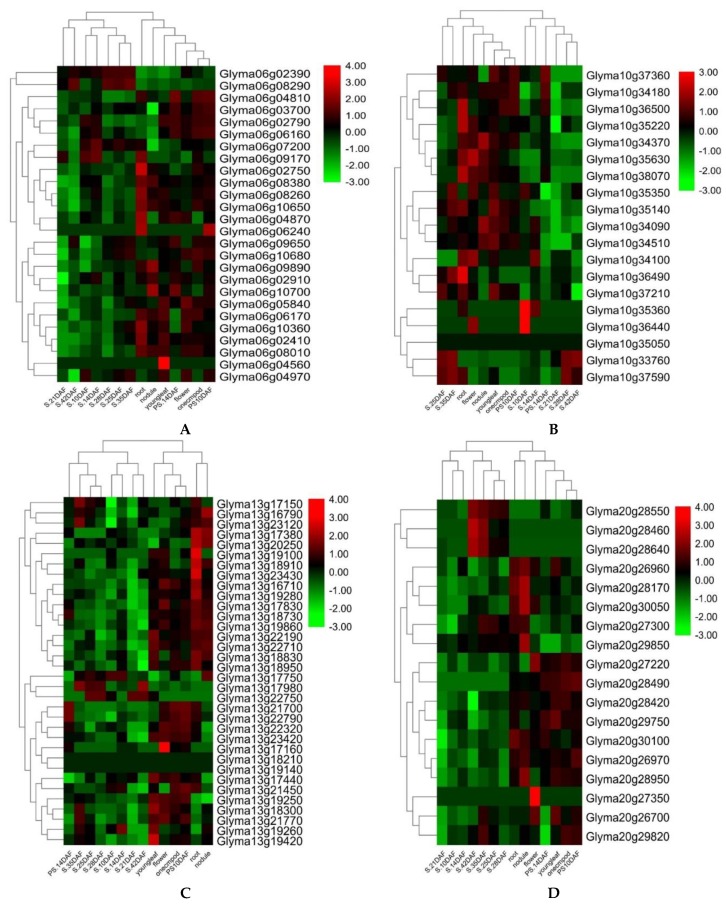
Figure 5.
Heat map exhibiting the expression profiles of 23 candidate genes among the different soybean tissues and development stages from four QTL hotspots/clusters. (A) Cluster-06 (QTL Hotspot A), (B) Cluster-10 (QTL Hotspot B), (C) Cluster-13 (QTL Hotspot C), and (D) Cluster-20 (QTL Hotspot D). Heat map was generated using the RNA-sequencing data downloaded from online dataset SoyBase. Youngleaf—young leaf, Onecmpod—1 cm of pod, PS—pod shell, DAF—days after flowering, and S—seed.

