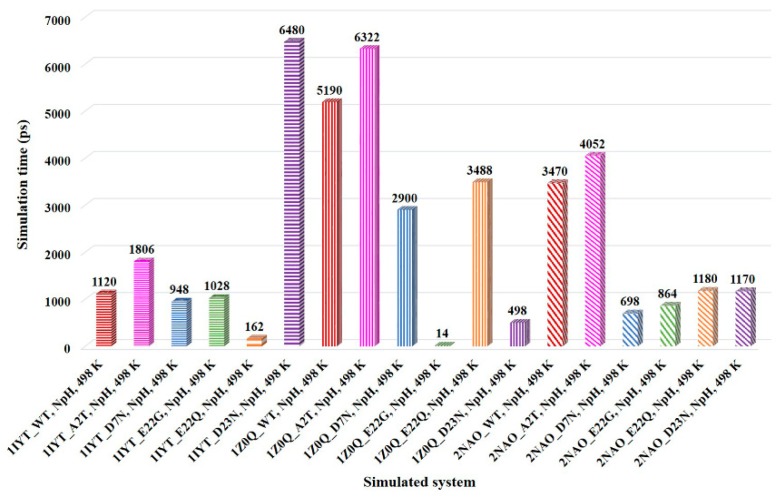
Figure 4.
Comparison of the α-strand appearance time in region 24–26 for the simulated systems. WT, A2T, D7N, E22G, E22Q, and D23N systems are represented by red, pink, blue, green, orange, and purple bars, respectively. Except for the systems with A2T mutation and the 1IYT_ D23N system, mutant systems showed an α-strand structure in the shorter simulation time as compared to the WT systems in all the simulated PDBs.

