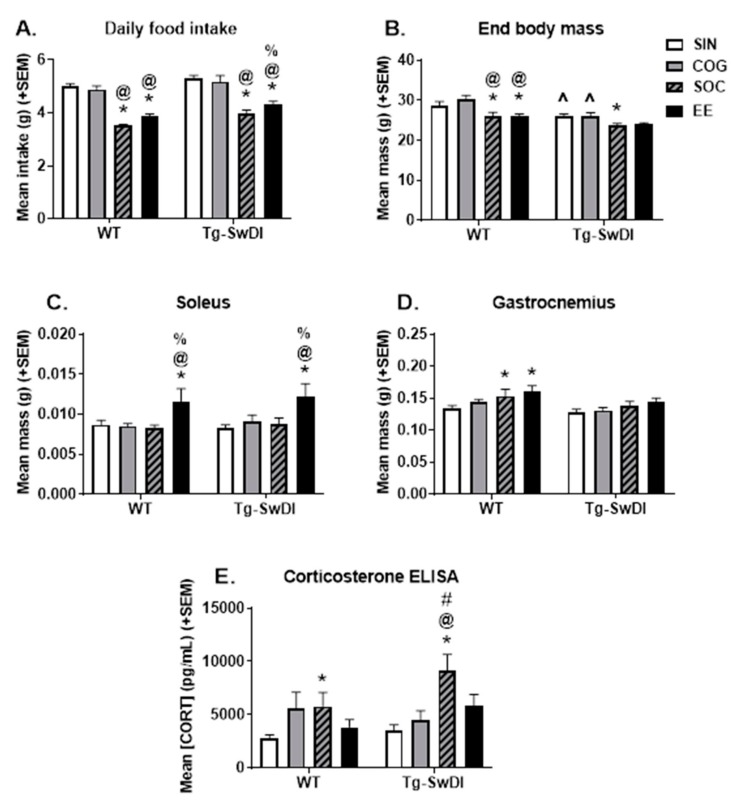
Figure 3.
Physiological measures. (A) Mean daily food intake over the course of the 4-month intervention period. Generally, Tg-SwDI mice ate more than WT mice, while SOC and EE housing attenuated food intake in WT and Tg-SwDI mice. (B) Body weight at the end of the experiment. Generally, the Tg-SwDI mice weighed less than the WT mice. SOC (both WT and Tg-SwDI), and EE (WT only) reduced body weight. (C) Soleus mass was increased by EE housing in both WT and Tg-SwDI mice. (D) Overall, Tg-SwDI mice tended to have a smaller gastrocnemius. There were trends of SOC and EE mice of both genotypes having a larger gastrocnemius, but this was only significant in WT mice. (E) Corticosterone levels measured by ELISA. * p < 0.05 vs. SIN of the same genotype, @ p < 0.05 vs. COG of the same genotype, % p < 0.05 vs. SOC of the same genotype, # p < 0.05 vs. EE of the same genotype, ^ p < 0.05 vs. WT in the same housing condition.

