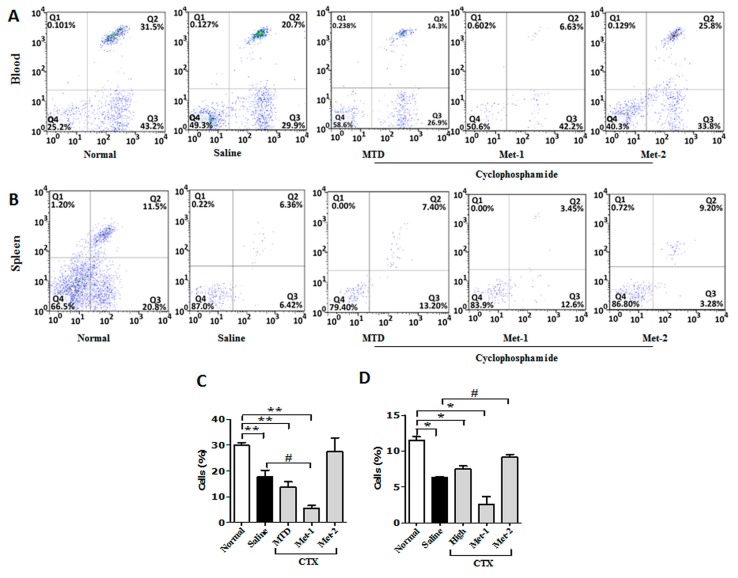
Figure 5.
CD3+/CD8+ T cells in blood (A,C) and spleen (B,D) from each group at the end of the observation period were measured by flow cytometry analysis. Fresh blood was collected in EDTA tubes and flow cytometry analysis was performed as described previously. “*” versus normal group and “#” versus saline group. *p < 0.05, #p < 0.05, **p < 0.01.

