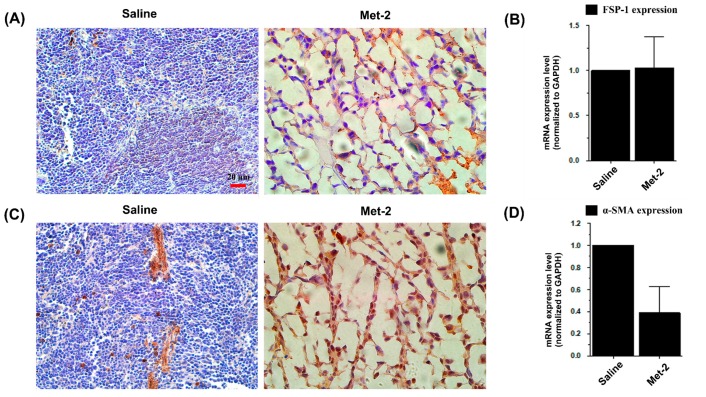
Figure 9.
Effect of metronomic cyclophosphamide on tumor-associated fibroblasts (TAFs). (A) Immunohistochemistry of FSP-1 in the tumor microenvironment, scale bar = 20 μm. (B) qPCR analysis for the mRNA level of FSP-1 in the tumor microenvironment. (C) Immunohistochemistry of α-SMA in the tumor microenvironment α-SMA, scale bar = 20 μm. (D) qPCR analysis for the mRNA level of α-SMA in the tumor microenvironment. H&E staining was performed as indicated above. Tumors were collected and total RNA was isolated; then, qPCR was performed as previously described.

