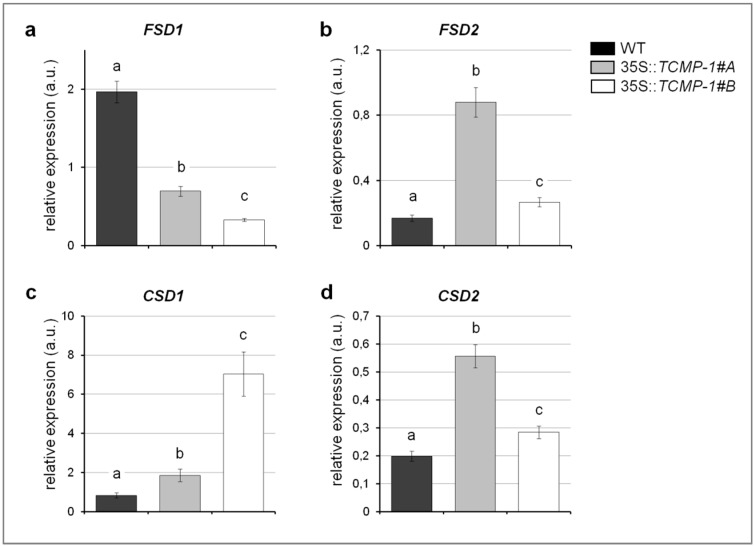
Figure 5.
Real-time PCR analysis of (a) FSD1, (b) FSD2, (c) CSD1, and (d) CSD2 transcripts in wild-type (WT) and TCMP-1-overexpressing plants treated for 24 h with 10 µM CdSO4. The histograms show the 2−ΔΔCT values ± SE (n = 3). Each value reported in histograms is normalized to the same sample in control conditions at the same time point. Statistically significant variations (p < 0.05) are marked with different letters.

