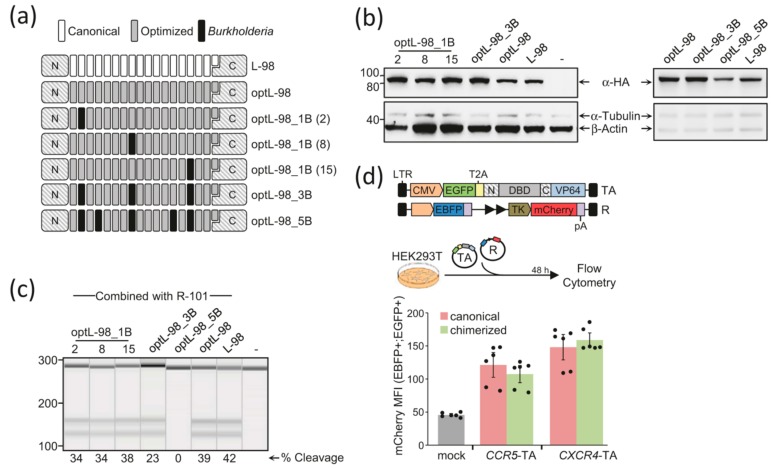
Figure 1.
Chimerization results in functional TALE-based nucleases and transcriptional activators. (a) Schematics of chimerized TALE DNA binding domains (DBDs). The DNA sequence coding for canonical TALE-DBD (white) is extensively modified to minimize intra- and inter-module repetitiveness (grey). In addition, chimerized TALE-DBD include TALE repeats derived from the bacterium Burkholderia rhizoxinica (black). (b) Expression levels of chimerized TALE nucleases. Expression levels were determined by immunoblotting using antibodies against HA-tag (top panel). A combination of antibodies recognizing α-Tubulin and β-Actin (lower panel) are used to normalize the total protein content. The positions of the relevant proteins are indicated in the middle and the protein marker (in kDa) on the left. (c) Activity of optimized and chimerized TALE nucleases. Capillary electrophoresis gel image (QIAxcel System, Qiagen) showing the target locus disruption assayed by T7 Endonuclease 1 (T7E1) assay. The extent of cleavage (as percentage of modified alleles) is indicated below each lane. (d) Activity of chimerized transcriptional activators (TA). To monitor the activity of the TAs, we generated a reporter construct (R) that included the corresponding binding sites of the TAs in tandem (black triangles), followed by a minimal promoter fragment from the HSV thymidine kinase (TK) gene adjacent to a mCherry expression cassette (upper panel). The expression cassette for an enhanced blue fluorescent protein (EBFP) driven by the CMV is included to track the reporter construct. The activity of TAs was measured by co-transfecting the corresponding TALE-TA expression plasmid and the reporter in HEK293T cells (upper panel). The TAs are driven by a cytomegalovirus (CMV) promoter and, to track their expression, are fused to the C-terminus of an enhanced green fluorescent protein (EGFP) via a T2A peptide. TAs containing either the canonical (light red) or the best-performing chimerized TALE-DBD (light green) were compared side-by-side for their ability to bind to their intended target sites and drive mCherry expression via flow cytometry, 48 h post transfection. The histogram shows the mCherry expression levels (mean ± SEM), measured as mean fluorescence intensity (MFI), in the fraction of cells that received both the effector (EGFP+) and the reporter plasmids (EBFP+). Each dot represents a single data point. Basal mCherry expression levels are measured by transfecting an effector plasmid lacking the DNA binding domain (mock, grey bar). pA, poly adenylation signal and LTR, long terminal repeat.

