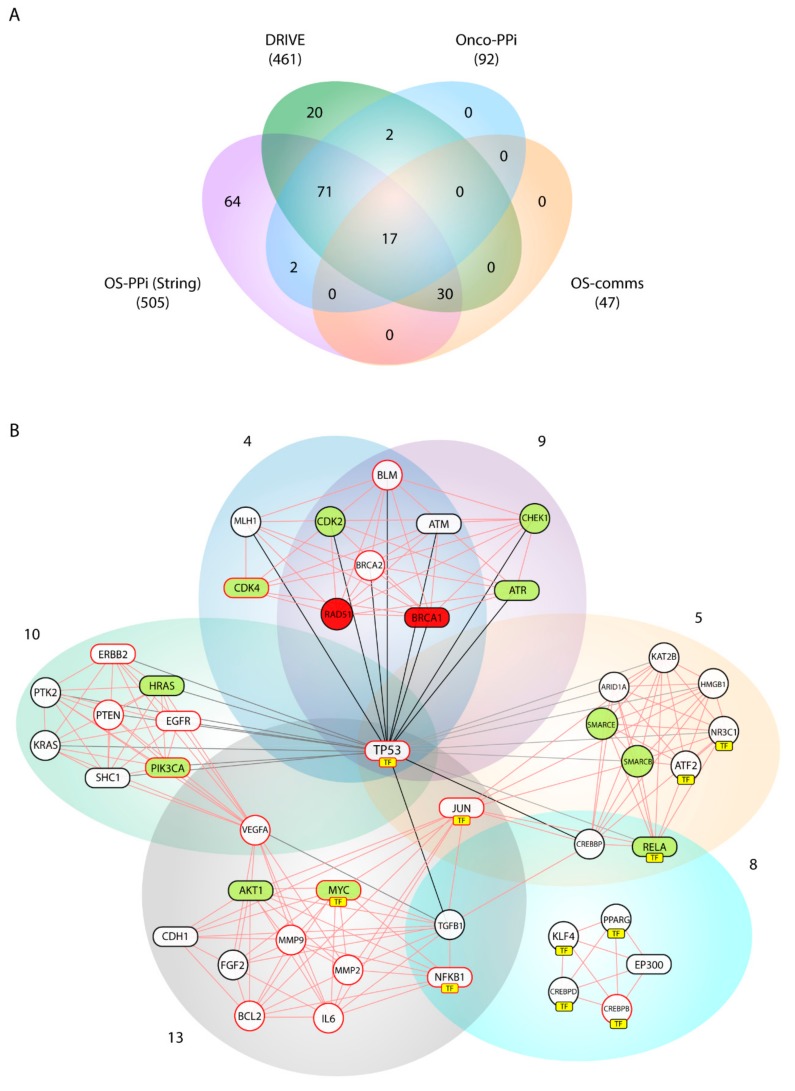
Figure 4.
Gene validation and network analysis of the k = 9-clique. (A) Comparison of prioritized genes from STRING (OS-PPI), DRIVE Project, OncoPPi network, and Cfinder analysis; (B) Network analysis from Communities 9, 13, 4, 5 8, and 10 (OS–comms network). Red and green painted nodes are defined as essential and active genes, respectively, based on the results from the DRIVE project. Nodes enclosed in rectangles belong to the analyzed OncoPPI network. Nodes with red borders are members of G1 and G2. Yellow boxes (TF) point to nodes identified as transcription factors.

