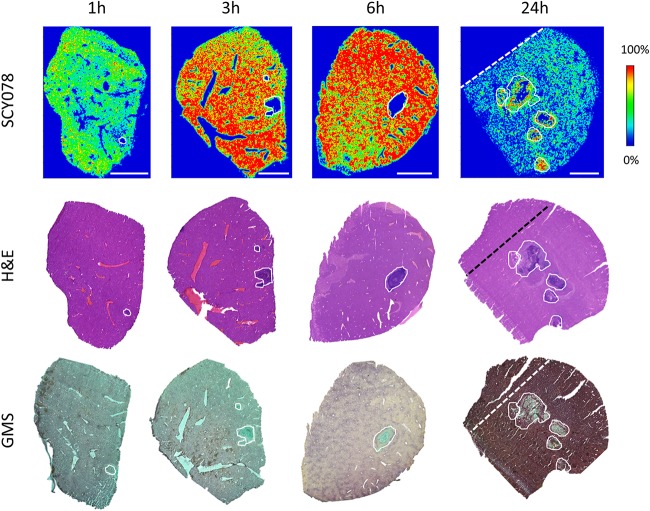
FIG 2.
Drug distribution in infected liver tissues after a single dose of IBX. (Upper row) Ion maps of IBX in representative liver tissues collected 1, 3, 6, and 24 h after a single oral dose of IBX at 30 mg/kg. The signal intensity color bar is fixed for IBX, with gradually increased intensity from blue (no signal) to red (max signal). H&E (middle row) and GMS (bottom row) staining of adjacent sections are shown below each ion map. Scale bars, 3 mm. Outlines highlight the lesion area on each tissue section. Dashed lines on 24-h samples denote that the upper left part of the nonlesion tissue seen on H&E- and GMS-stained sections was trimmed off the section subjected to MALDI-MSI.

