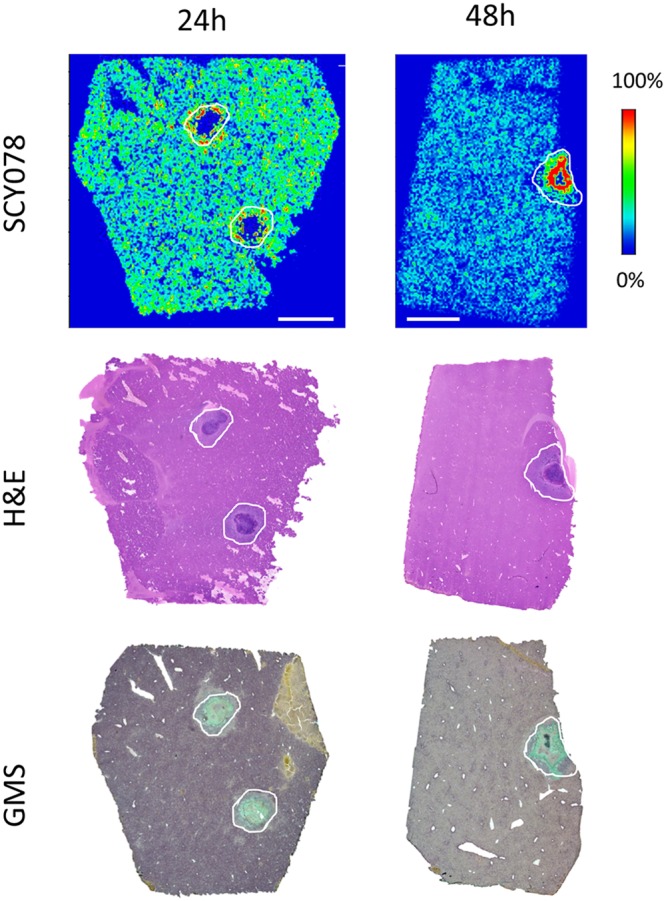
FIG 4.

Drug distribution in infected liver tissues after repeated doses of IBX. (Upper row) Ion maps of IBX in representative liver tissues collected 24 and 48 h after the last dose of a 2-day treatment of IBX at 15 mg/kg, BID. The signal intensity color bar is fixed for IBX, with gradually increased intensity from blue (no signal) to red (max signal). The middle and bottom rows show H&E and GMS staining, respectively, of adjacent sections at each corresponding time point. Scale bars, 3 mm.
