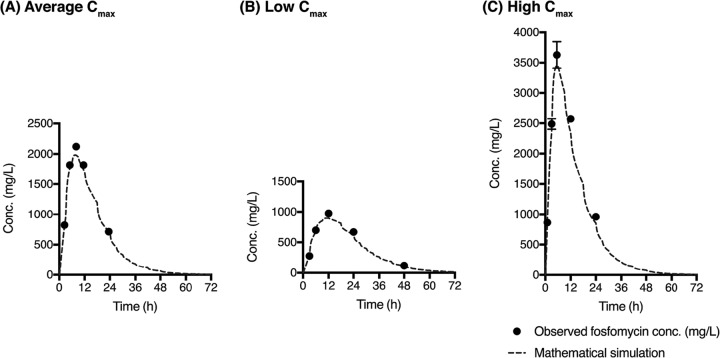
FIG 3.
Single-dose fosfomycin urinary concentrations. Fosfomycin was administered as a single dose, simulating an oral 3-g dose with average exposure (A), low urinary Cmax (B), and high urinary Cmax (C). The average measured fosfomycin concentrations are overlaid on the target concentration-time curves (dashed line). Note that the mathematically simulated urinary concentration curves do not demonstrate a smooth drug elimination phase due to the dynamic fluid shifts that occur after each voiding cycle of the bladder compartment.

