FIG 2.

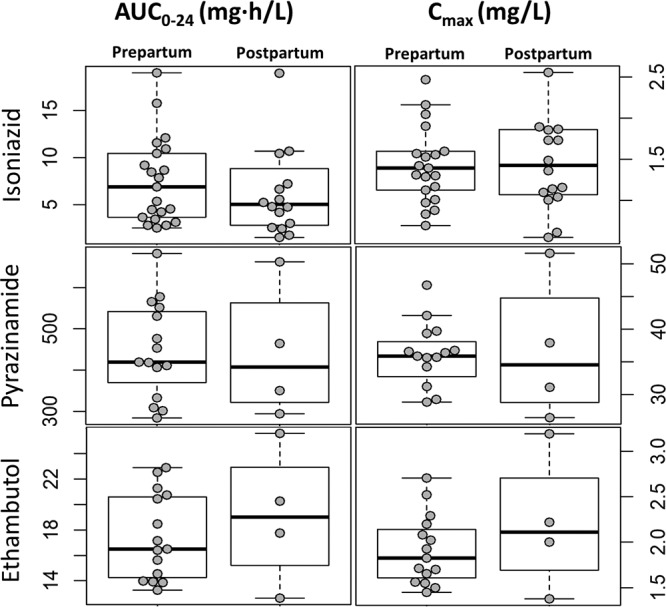
Box and whisker plots showing the AUC0–24 and Cmax values for the three drugs stratified by pre- and postpartum conditions. The dots represent individual values. Whiskers show the 2.5th and 97.5th percentiles.

Box and whisker plots showing the AUC0–24 and Cmax values for the three drugs stratified by pre- and postpartum conditions. The dots represent individual values. Whiskers show the 2.5th and 97.5th percentiles.