FIG 5.
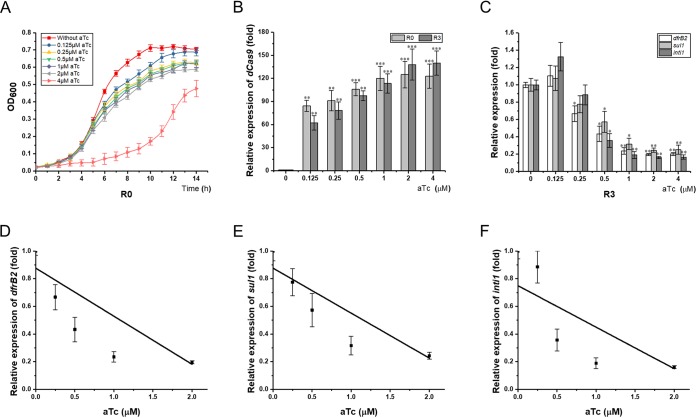
Titration of CRISPRi system in E. coli. (A) Growth curve of the control strain upon induction with 2-fold serial concentrations of aTc ranging from 0 to 4 μM. (B) Transcription of dcas9 gene in recombinant E. coli harboring plasmid R388 and either recombinant plasmid plv-dCas9-R3 or plv-dCas9-R0 upon induction by aTc ranging from 0 to 4 μM. (C) Transcriptional levels of the dfrB2 cassette, sul1, and intI1 in the CRISPRi strain harboring sgRNA R3 upon induction by aTc at concentrations ranging from 0 to 4 μM. (D to F) Correlation analysis between the transcription of the dfrB2 cassette (D), sul1 (E), or intI1 (F) and the aTc concentration ranging from 0 to 2 μM. aTc, anhydrotetracycline; R0, E. coli C600(R388/plv-dCas9-R0); R3, E. coli C600(R388/plv-dCas9-R3). Asterisks indicate significant differences between results for aTc-treated and untreated strains (*, P < 0.05; **, P < 0.01; ***, P < 0.001).

