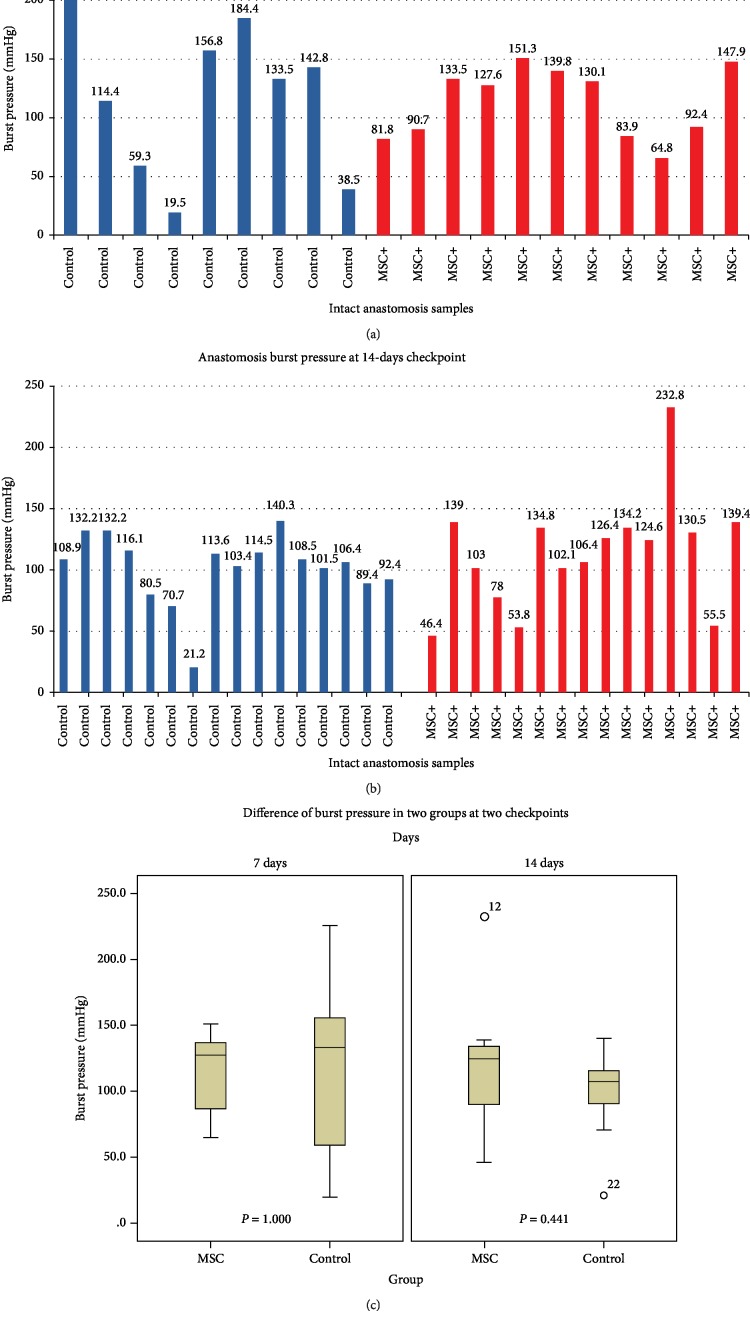
Figure 1.
Comparison of burst pressures between the two groups. (a) Burst pressures of intact anastomoses at the 7 d timepoint in the MSC-treated group (n = 11) and the control group (n = 9). (b) Burst pressures of intact anastomoses at the 14 d timepoint in the MSC-treated group (n = 15) and the control group (n = 16). (c) Comparison of burst pressures between the two groups.

