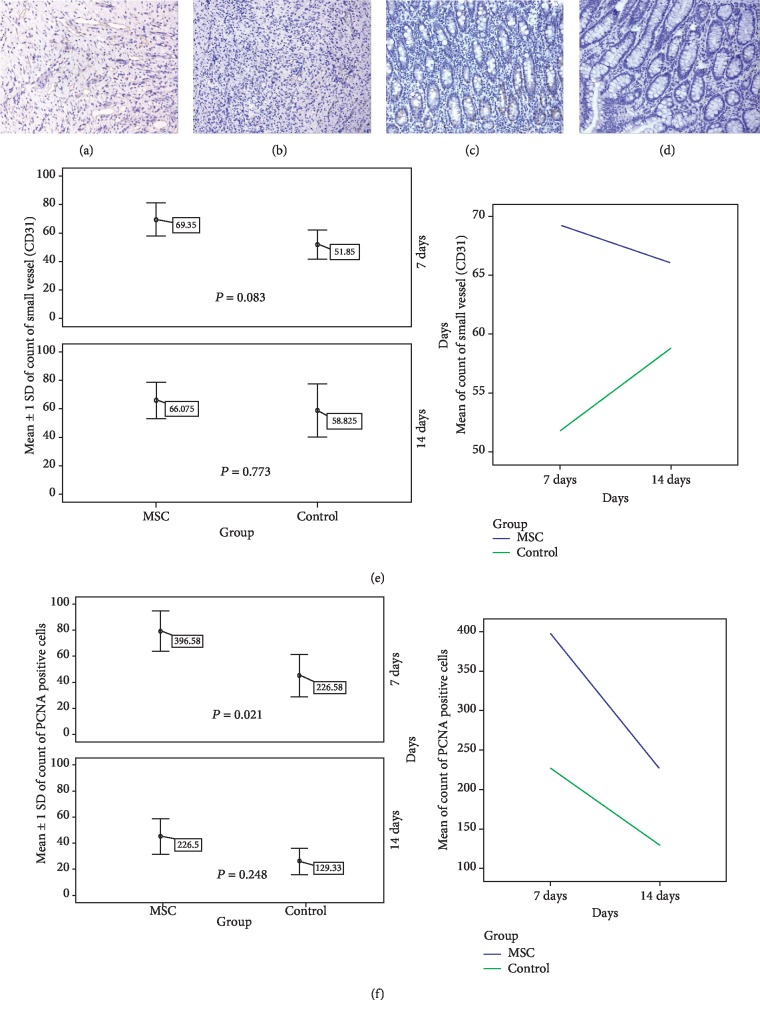
Figure 2.
Between-group comparison of PCNA and CD31. (a) IHC image of CD31 (ID PH34, MSC-treated group, 7 d, 200x). (b) IHC image of CD31 (ID PH36, control group, 7 d, 200x). (c) IHC image of PCNA (ID PH37, MSC-treated group, 7 d, 200x). (d) IHC image of PCNA (ID PH36, control group, 7 d, 200x). (e) Between-group comparison of the number of CD31-stained small vessels (n = 4). (f) Comparison of the number of PCNA-positive cells between the two groups (n = 4).

