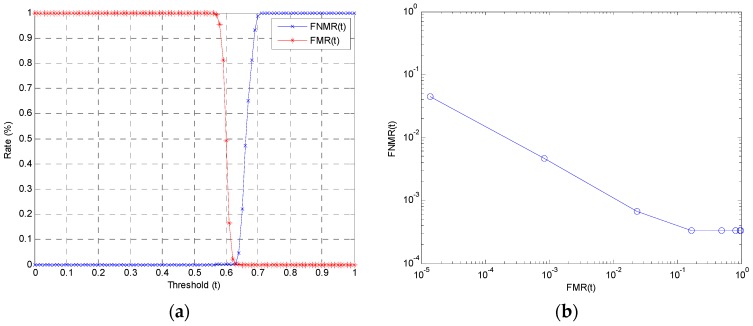
Figure 13.
Illustration of the performance evaluation on the PF07 database: (a) the distribution of false not-matching rate (FNMR) and false matching rate (FMR) with threshold value t varying from 0.0 to 1.0, and (b) the log-log scale receiving operation curve (ROC) with the false not-matching rate and false matching rate.

