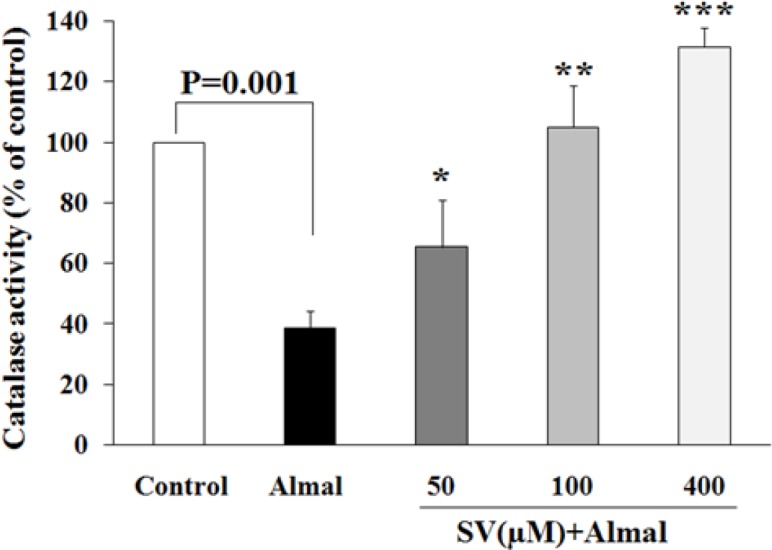
Figure 6.
Evaluation of CAT activity of PC12 cells co-treated with Almal (1000 µM) and SV (50–400 μM). The histograms represent mean±SD of CAT activity obtained from at least three experiments. One-way ANOVA and LSD post hoc test were used for the analysis of data. * shows significant difference at P-value<0.05 compared with the control group, ** and *** show significant difference at P-value<0.01 and P-value<0.001 compared with the Almal group, respectively

SV: Sodium valproate; CAT: Catalase activity
