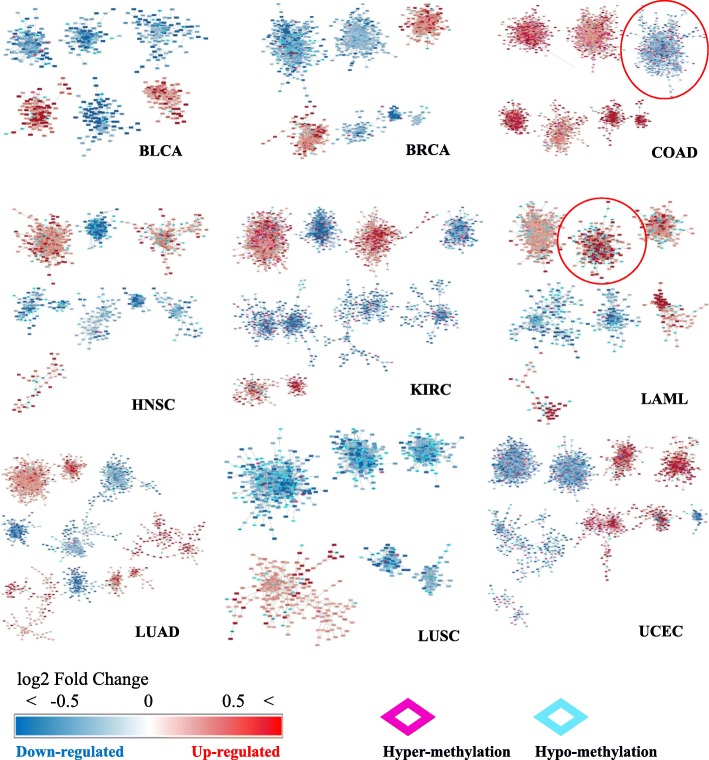
Fig. 4.
Graph-based clustering results. Up-regulated DEGs are colored in red, and down-regulated DEGs are colored in blue. The diamond borders of the genes are colored in pink or sky blue when the promoters of the genes are either hypermethylated or hypomethylated, respectively. The red circles indicate the selected clusters in LAML and COAD

