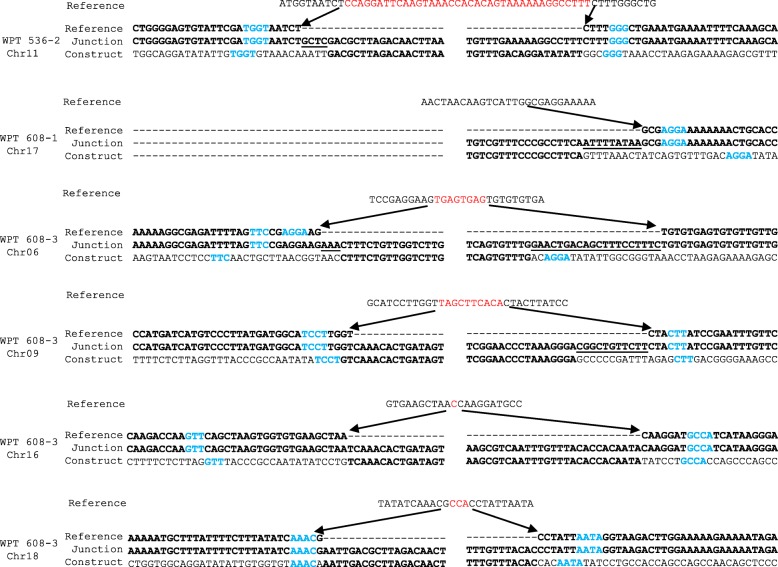
Fig. 5.
Microhomology evidence at transgene integration sites. Whole genome sequencing results at transgene insertion sites. Bases in blue represent regions of microhomology between the construct and reference genome. Bases in red represent the sequences deleted from the host genome at the transgene insertion. Bold sequences represent the sequences remaining in the transgenic plant. Underlines indicate base additions at the transgene insertion sites not previously found in the host genome nor the construct

